Reporting
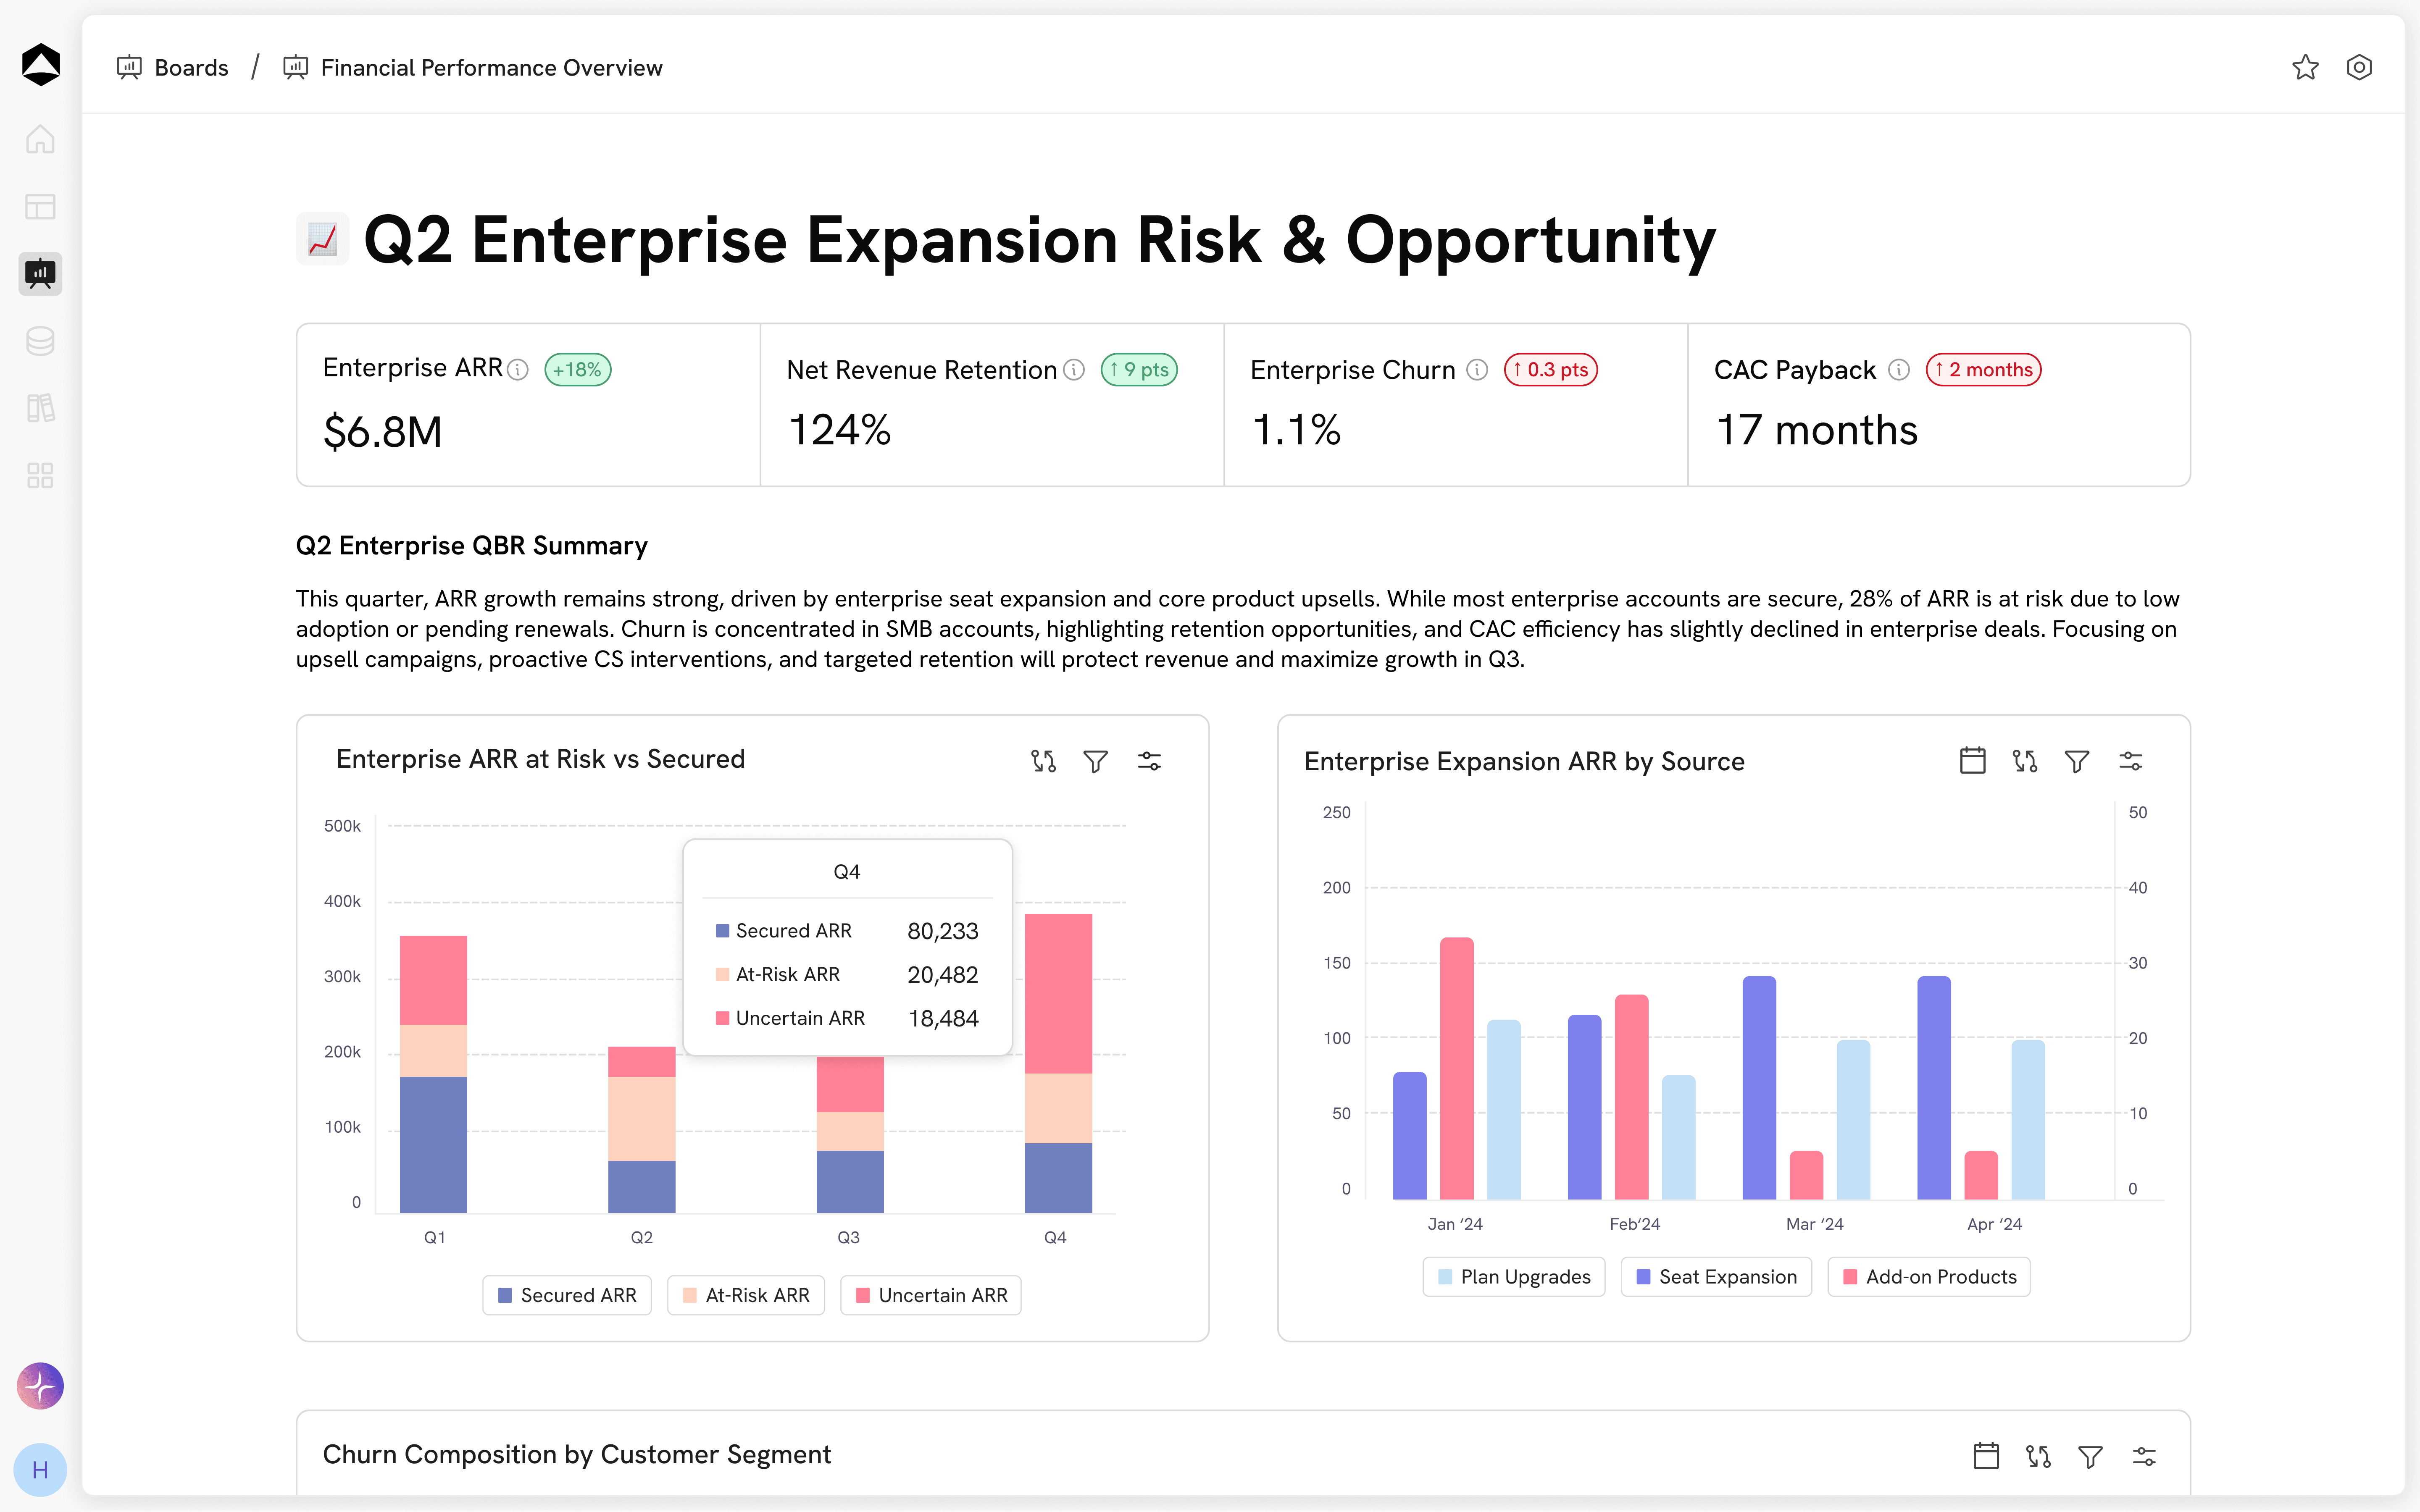
Align executives, finance, and teams around shared dashboards powered by the same integrated data, plans, and databases across Oculon.
Reporting
Align executives, finance, and teams around shared dashboards powered by the same integrated data, plans, and databases across Oculon.
Reporting
Align executives, finance, and teams around shared dashboards powered by the same integrated data, plans, and databases across Oculon.


Ask questions, get instant insight
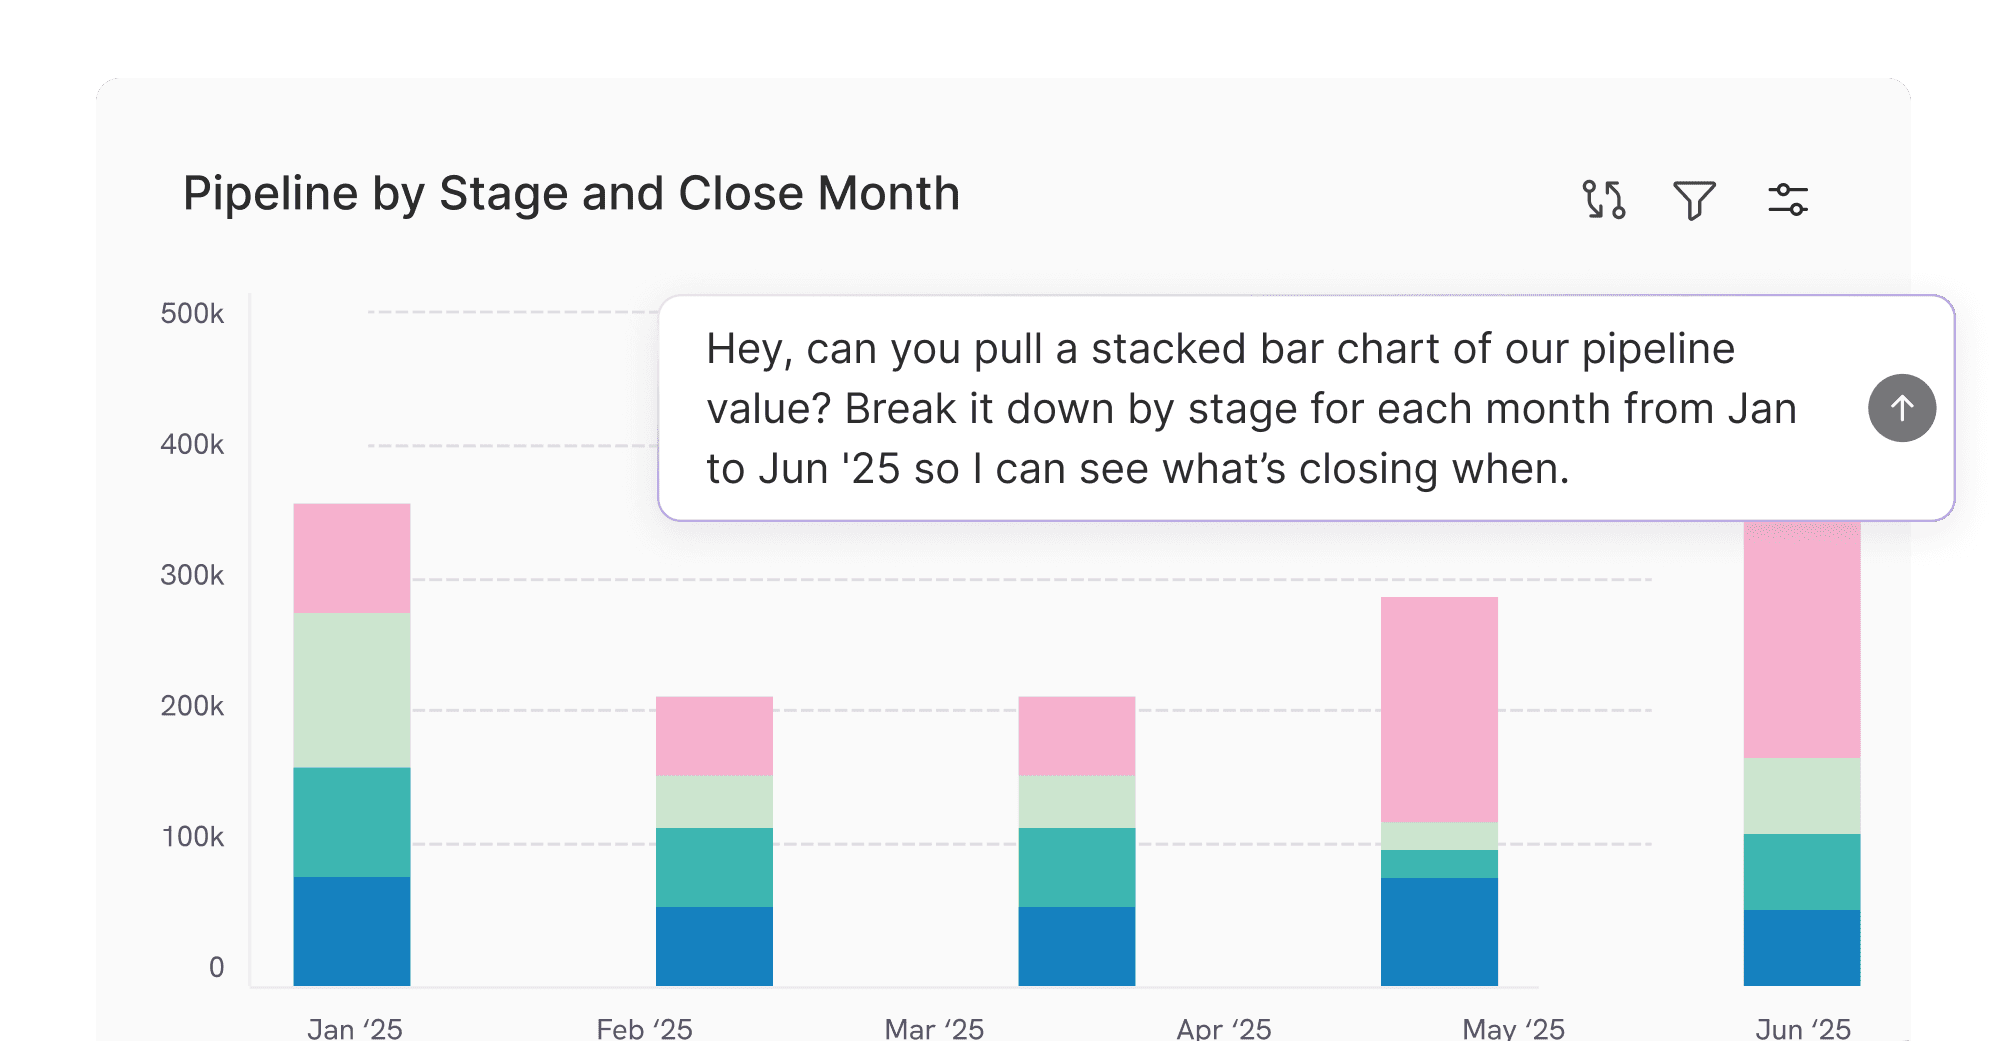
Use AI to query your boards in plain language, surface key drivers, and highlight anomalies without building complex reports by hand.
Always up to date, no refresh button
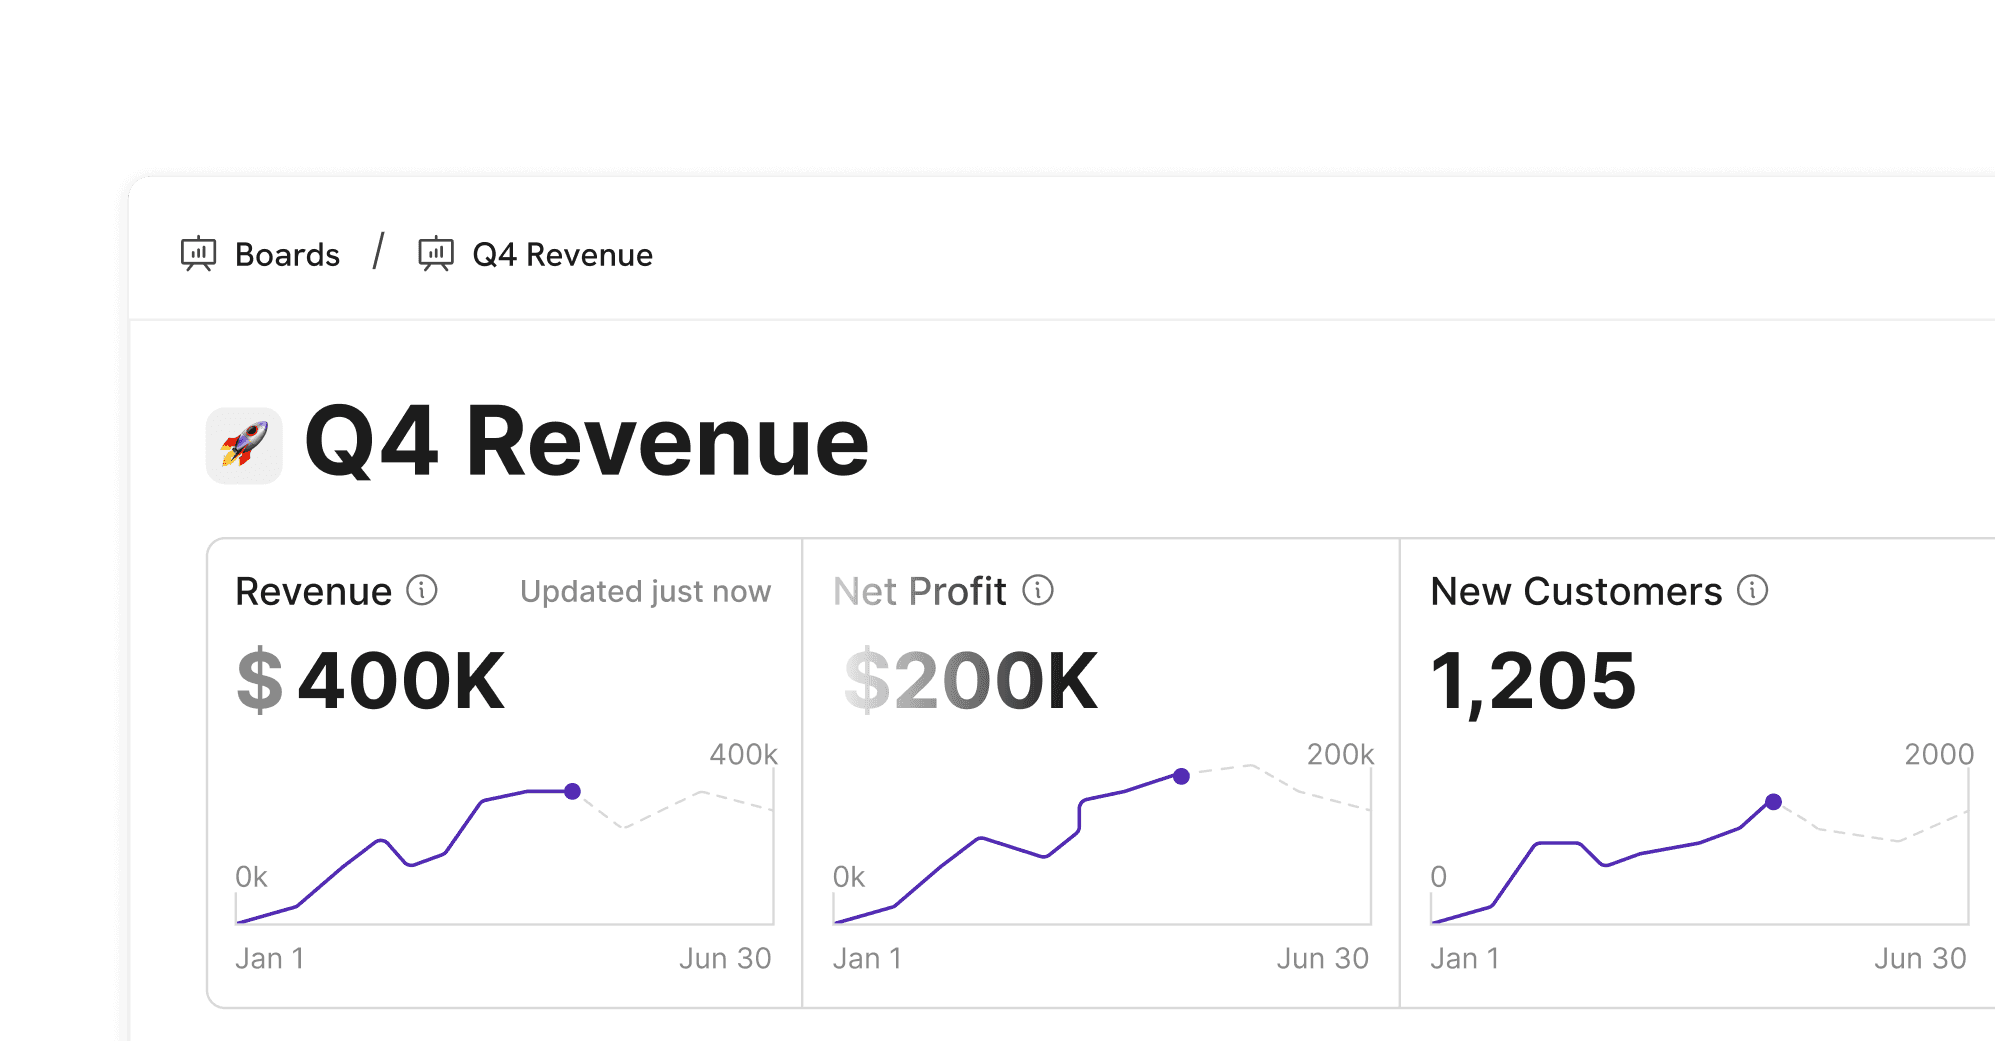
Boards stay in sync with live data and models, updating charts, KPIs, and variance views automatically as new information flows in.
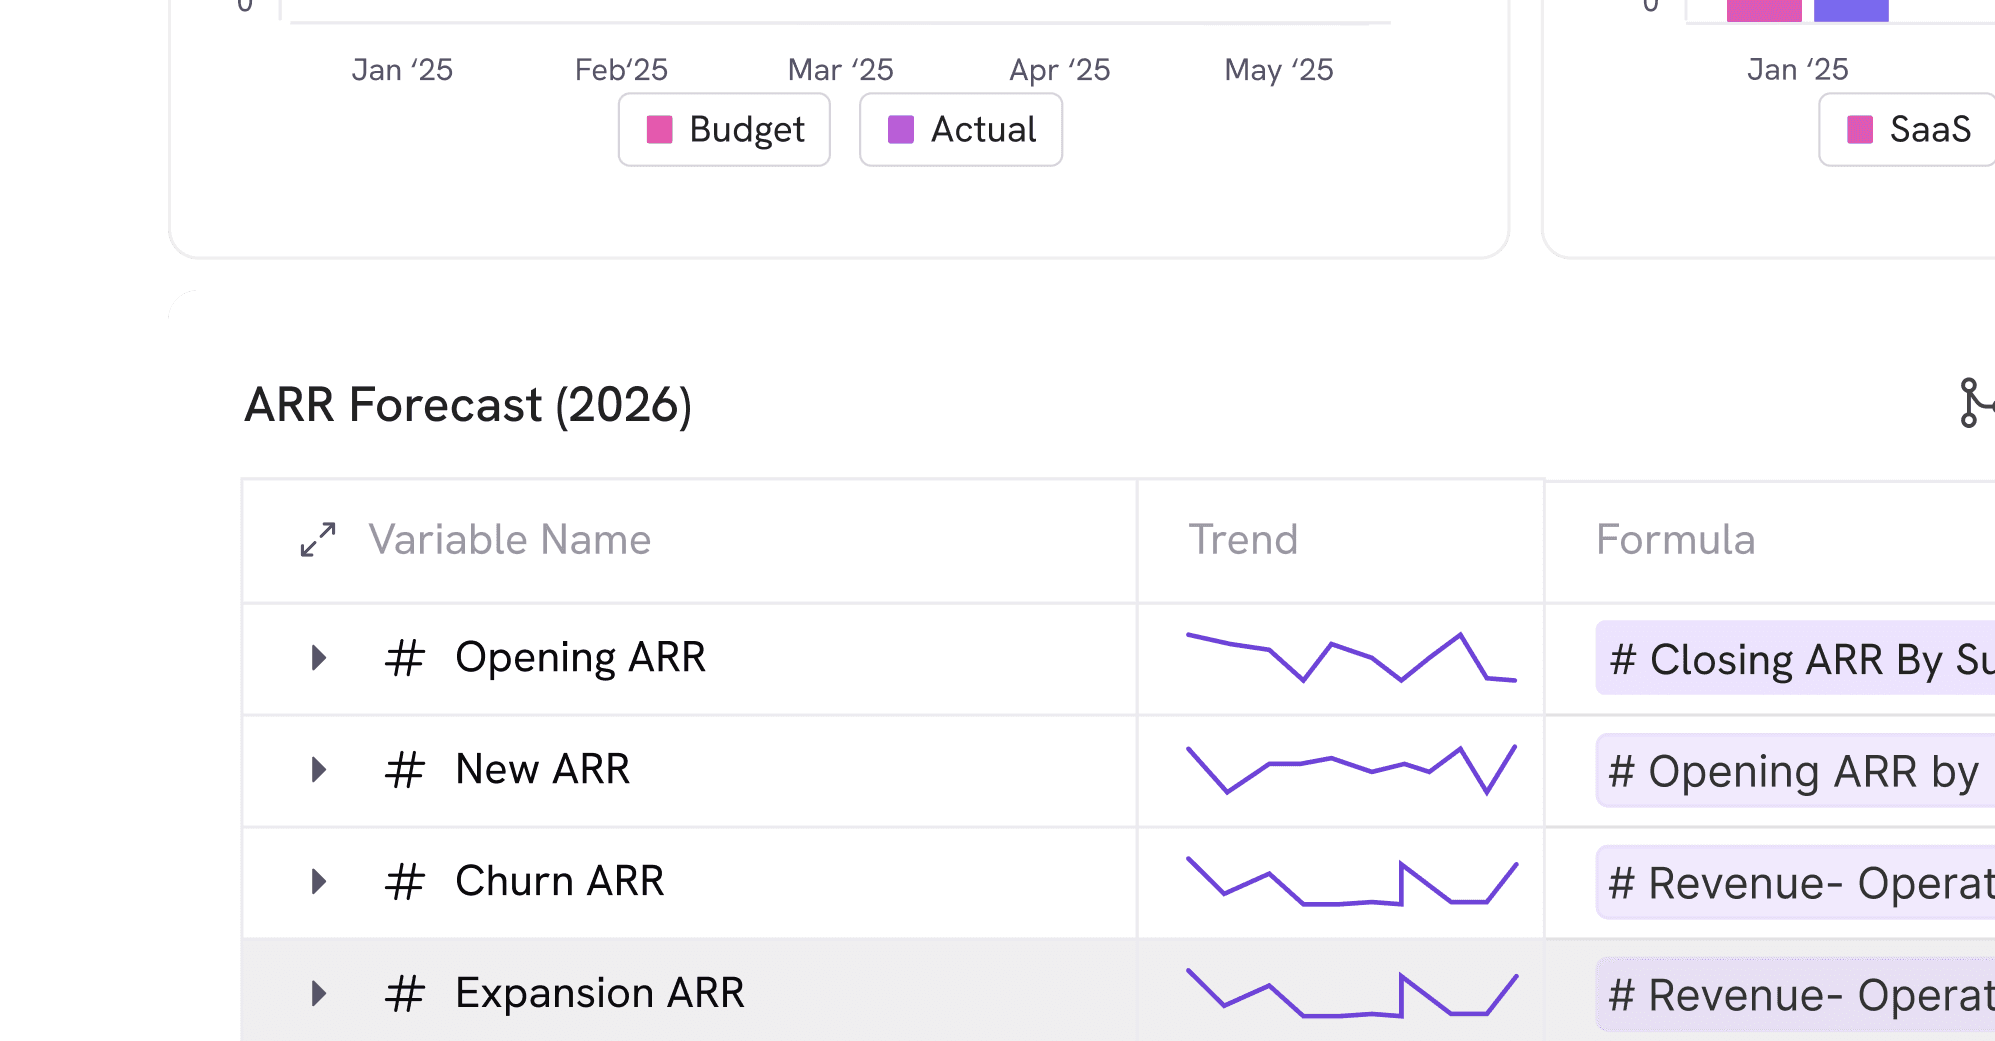
Build charts from reusable metrics
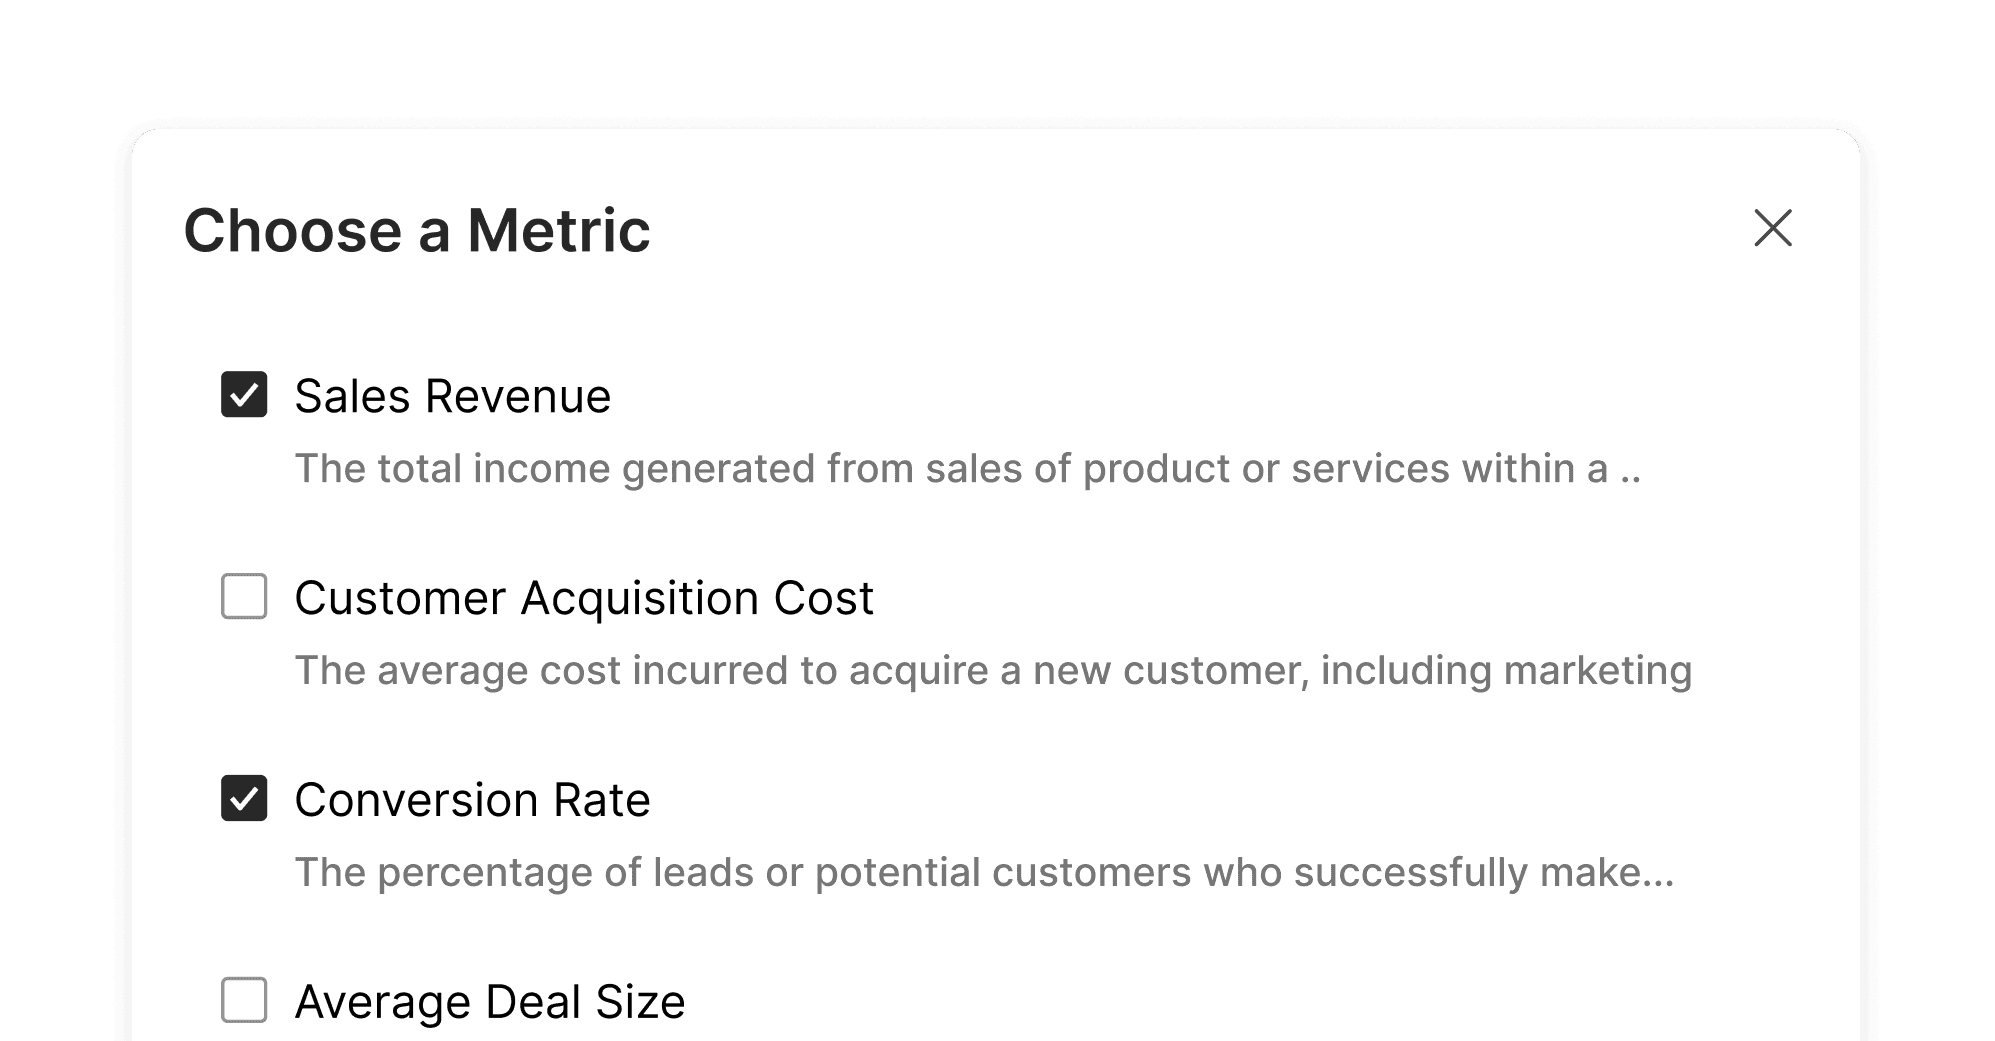
Create visuals from preconfigured metrics so finance can reuse definitions for revenue, margin, CAC, LTV, and more across all dashboards.
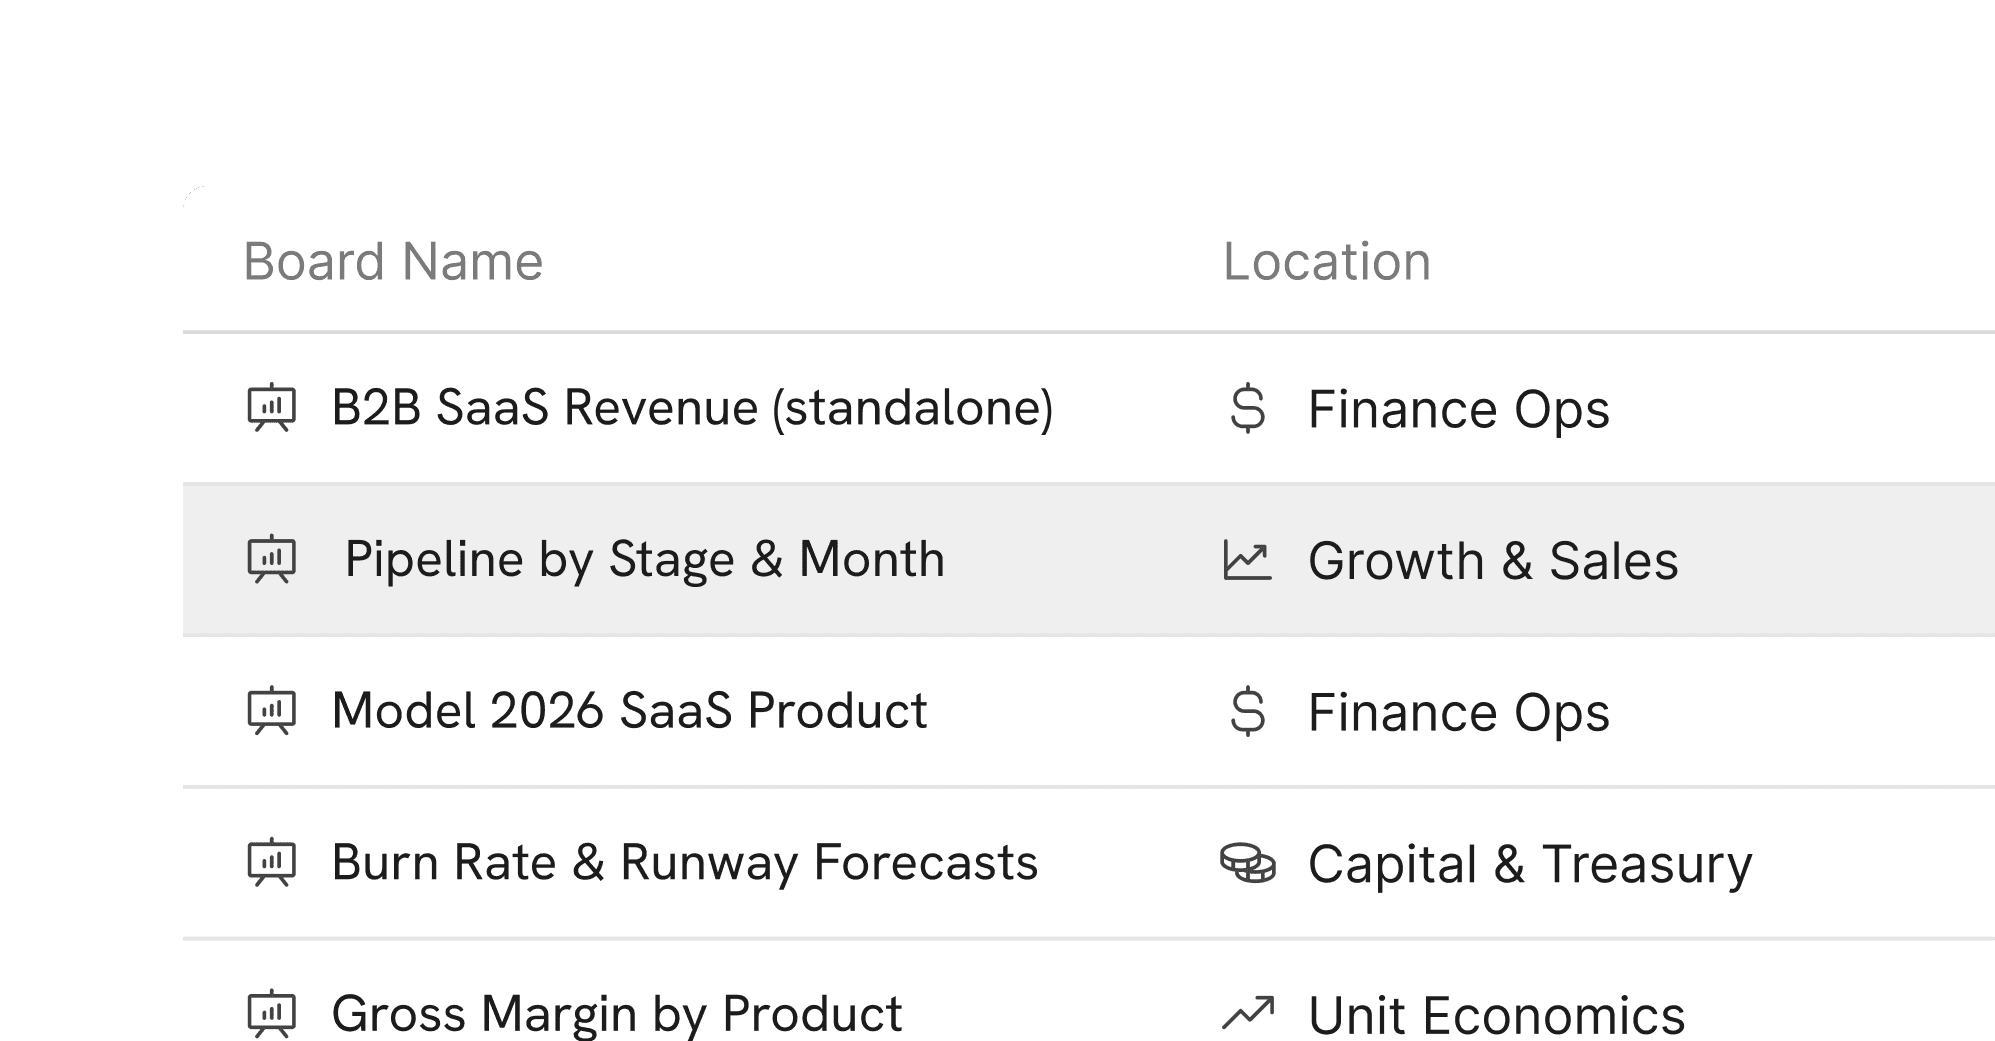
Organize boards around how teams work
Group pages by teams, projects, or KPIs, track page status, and standardize workflows so recurring reviews and rituals stay consistent.
Bring models and data into every board
Embed sections from models and databases directly into boards so stakeholders can go from high-level views to the underlying assumptions in a click.
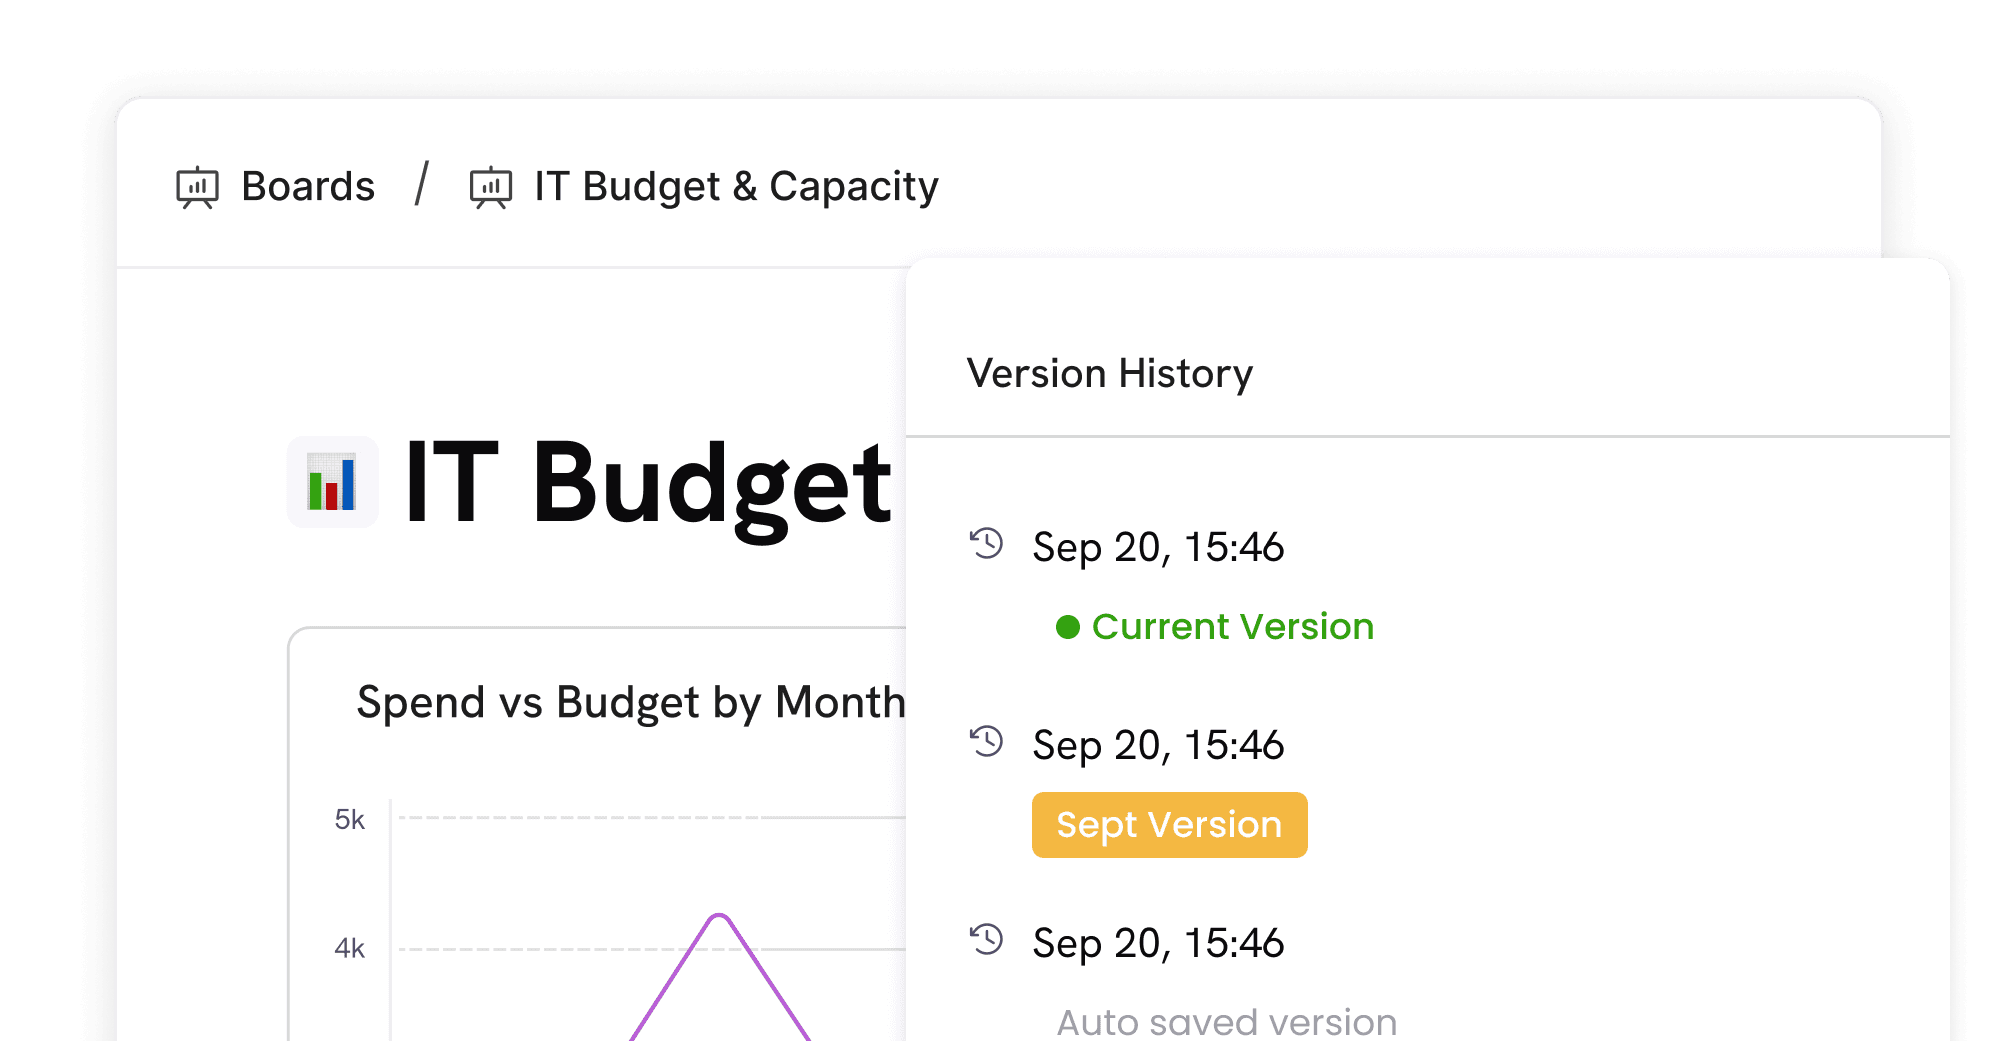
Compare versions and collaborate safely
Keep history of board versions, track what changed, and collaborate with comments and ownership without losing the audit trail.
Ask questions, get instant insight
Use AI to query your boards in plain language, surface key drivers, and highlight anomalies without building complex reports by hand.
Always up to date, no refresh button
Boards stay in sync with live data and models, updating charts, KPIs, and variance views automatically as new information flows in.
Build charts from reusable metrics
Create visuals from preconfigured metrics so finance can reuse definitions for revenue, margin, CAC, LTV, and more across all dashboards.
Organize boards around how teams work
Group pages by teams, projects, or KPIs, track page status, and standardize workflows so recurring reviews and rituals stay consistent.
Bring models and data into every board
Embed sections from models and databases directly into boards so stakeholders can go from high-level views to the underlying assumptions in a click.
Compare versions and collaborate safely
Keep history of board versions, track what changed, and collaborate with comments and ownership without losing the audit trail.
Use Cases
Boards turns your planning outputs and live data into actionable views for every audience, from exec reviews to daily standups.
01
Executive overview board
Give leadership a single place to track growth, profitability, and runway with live metrics and AI summaries.
02
Investor and board reporting
Prepare recurring investor updates faster by reusing the same validated metrics and layouts each month or quarter.
03
Department scorecards
Create boards for sales, marketing, product, and CS that combine financial targets with operational KPIs.
04
FP&A monthly close board
Track close status, key variances, and driver commentary so finance can move from numbers to narrative quickly.
05
RevOps and pipeline board
Pair pipeline, win rates, and forecast data with financial outcomes to keep GTM and finance aligned on targets.
06
Operations and capacity board
Monitor utilization, inventory, and throughput in one view, linking operational signals back to financial impact.
Frequently asked questions about Oculon Boards.
How is Boards different from traditional BI tools?
Boards is built for finance-first workflows, combining reporting, planning context, and AI explanations in one place instead of separate dashboards and spreadsheets.
Where does the data shown in Boards come from?
Dashboards pull directly from Oculon models and Base databases, so every chart and KPI reflects the same integrated, real-time data layer.
Can non-finance teams use Boards easily?
Yes, teams can create tailored views with their own layouts and filters while relying on shared metrics defined by finance.
How does AI on Boards help my team?
AI can answer questions on top of your data, highlight trends, and suggest points to discuss, reducing manual slicing and spreadsheet exports.
Can I customize layouts and permissions per board?
You can organize pages into spaces, control who can view or edit each board, and manage access at team or role level.
How do versions work for reports?
Boards keeps a history of changes so you can compare prior versions, reuse successful layouts, and maintain a clear trail for audits and governance.
FAQ
How is Boards different from traditional BI tools?
Boards is built for finance-first workflows, combining reporting, planning context, and AI explanations in one place instead of separate dashboards and spreadsheets.
Where does the data shown in Boards come from?
Dashboards pull directly from Oculon models and Base databases, so every chart and KPI reflects the same integrated, real-time data layer.
Can non-finance teams use Boards easily?
Yes, teams can create tailored views with their own layouts and filters while relying on shared metrics defined by finance.
How does AI on Boards help my team?
AI can answer questions on top of your data, highlight trends, and suggest points to discuss, reducing manual slicing and spreadsheet exports.
Can I customize layouts and permissions per board?
You can organize pages into spaces, control who can view or edit each board, and manage access at team or role level.
How do versions work for reports?
Boards keeps a history of changes so you can compare prior versions, reuse successful layouts, and maintain a clear trail for audits and governance.
Frequently asked questions about Oculon Boards.
How is Boards different from traditional BI tools?
Boards is built for finance-first workflows, combining reporting, planning context, and AI explanations in one place instead of separate dashboards and spreadsheets.
Where does the data shown in Boards come from?
Dashboards pull directly from Oculon models and Base databases, so every chart and KPI reflects the same integrated, real-time data layer.
Can non-finance teams use Boards easily?
Yes, teams can create tailored views with their own layouts and filters while relying on shared metrics defined by finance.
How does AI on Boards help my team?
AI can answer questions on top of your data, highlight trends, and suggest points to discuss, reducing manual slicing and spreadsheet exports.
Can I customize layouts and permissions per board?
You can organize pages into spaces, control who can view or edit each board, and manage access at team or role level.
How do versions work for reports?
Boards keeps a history of changes so you can compare prior versions, reuse successful layouts, and maintain a clear trail for audits and governance.
Start journey with
Oculon

Start journey with
Oculon
Start journey with
Oculon