Changelog
Product updates. Improvements. Fixes.
v0.3.4
Oct 14, 2026
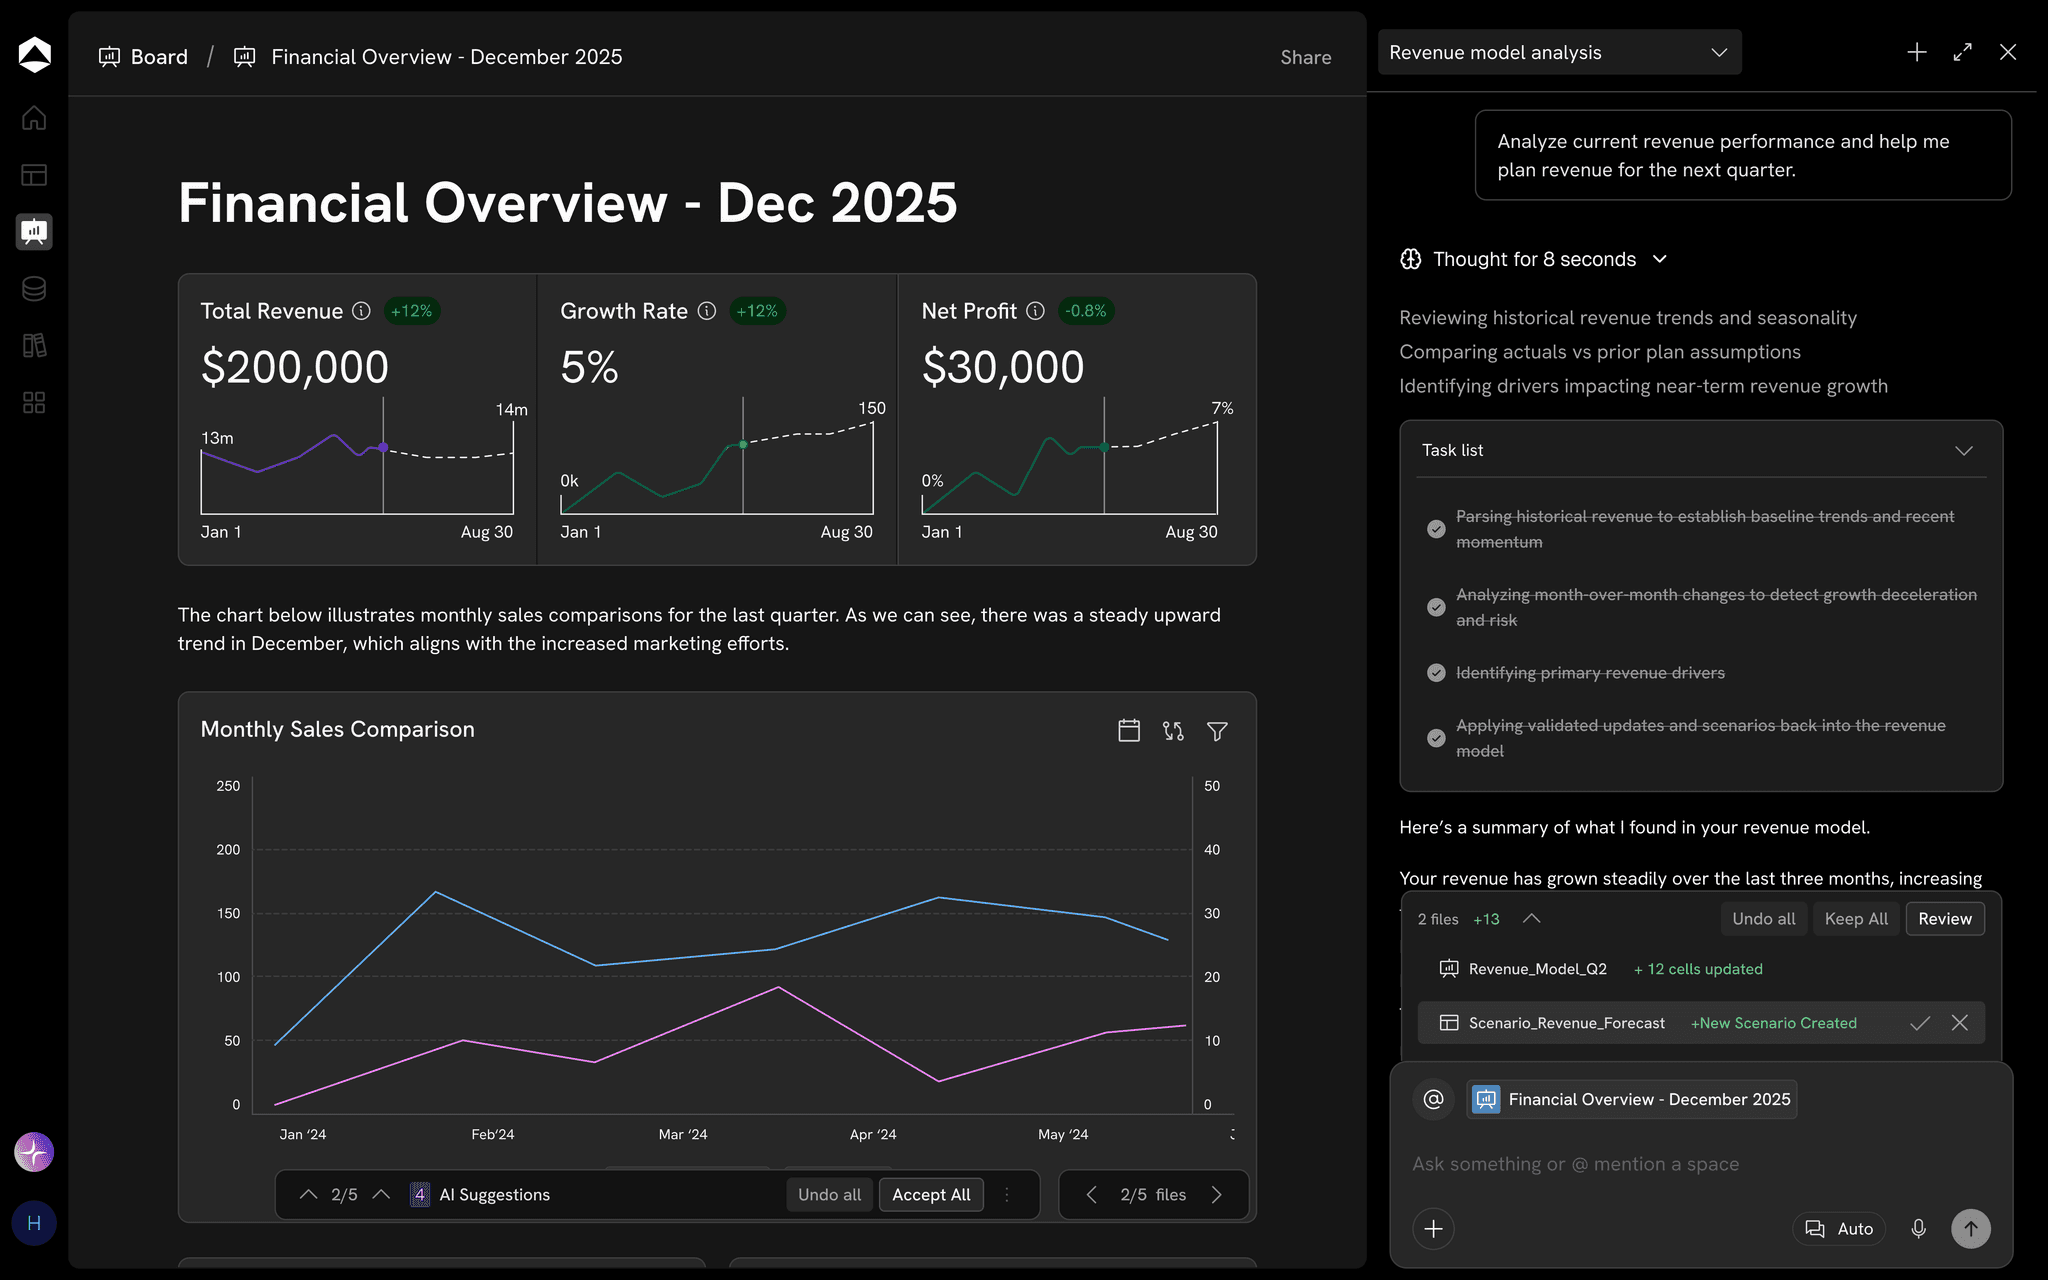
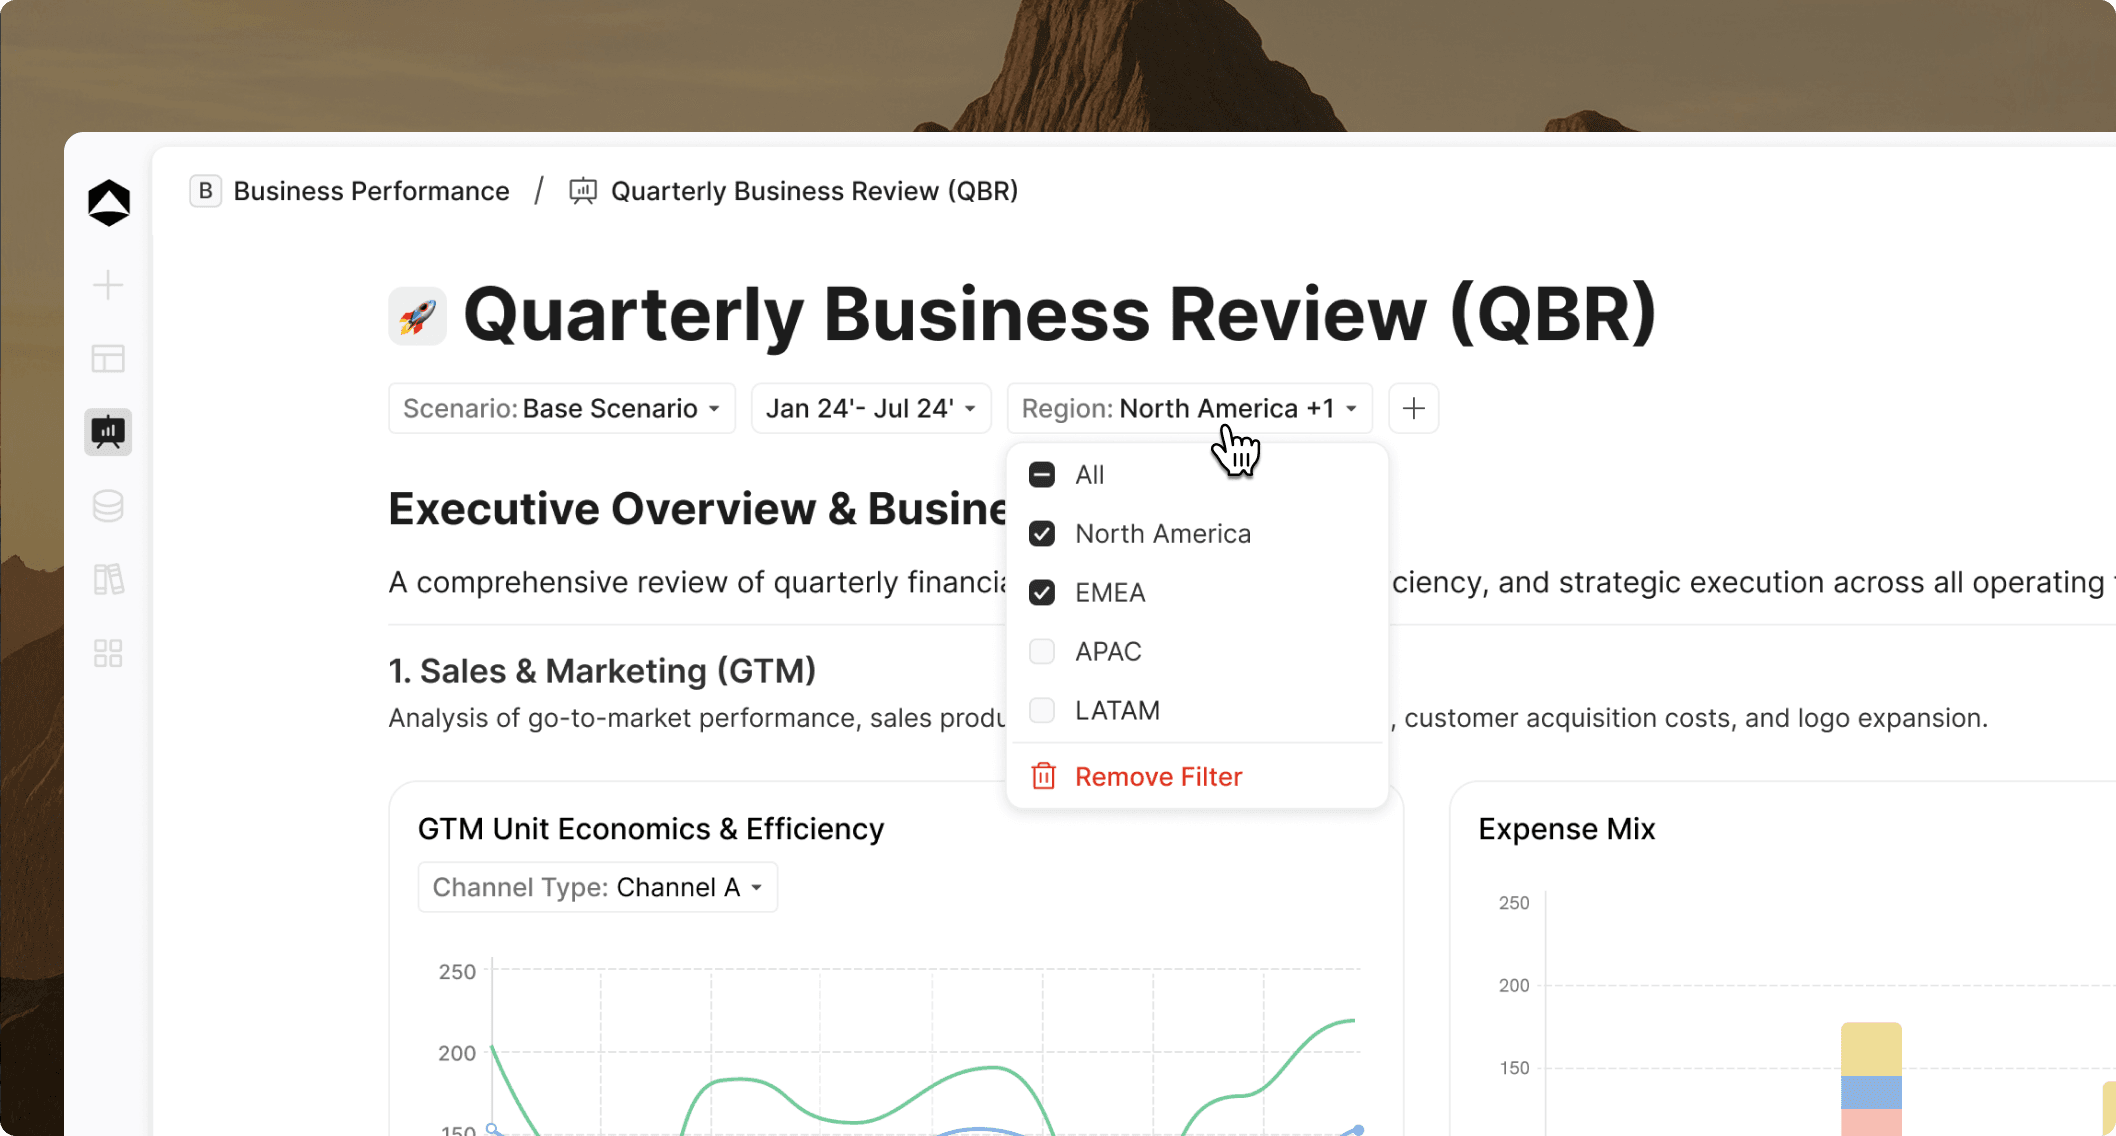
Dashboard page level filters
Change the reporting period or business slice without reconfiguring each card separately.
Oculon is adding page-level time and dimension filters so you can review a dashboard in one consistent context. Select a period, region, department, or another supported dimension from the filter bar at the top of the page.
v0.3.5
Oct 17, 2026
View and clear what AI chat remembers
Persistent memory can make AI more useful across conversations, but users need control over what continues to influence future responses. Oculon now provides visibility into stored memory and clear actions for removing it.
Chat history and persistent memory remain separate: clearing memory does not delete the conversation transcript.
What’s new
See how many workspace memory items are stored
Clear memory created from a specific chat
Let administrators clear all workspace memory
Confirm sensitive workspace-wide clearing before it runs
Continue using chat history without treating cleared information as persistent memory
v0.3.5
Oct 15, 2026
Find everything in the Library
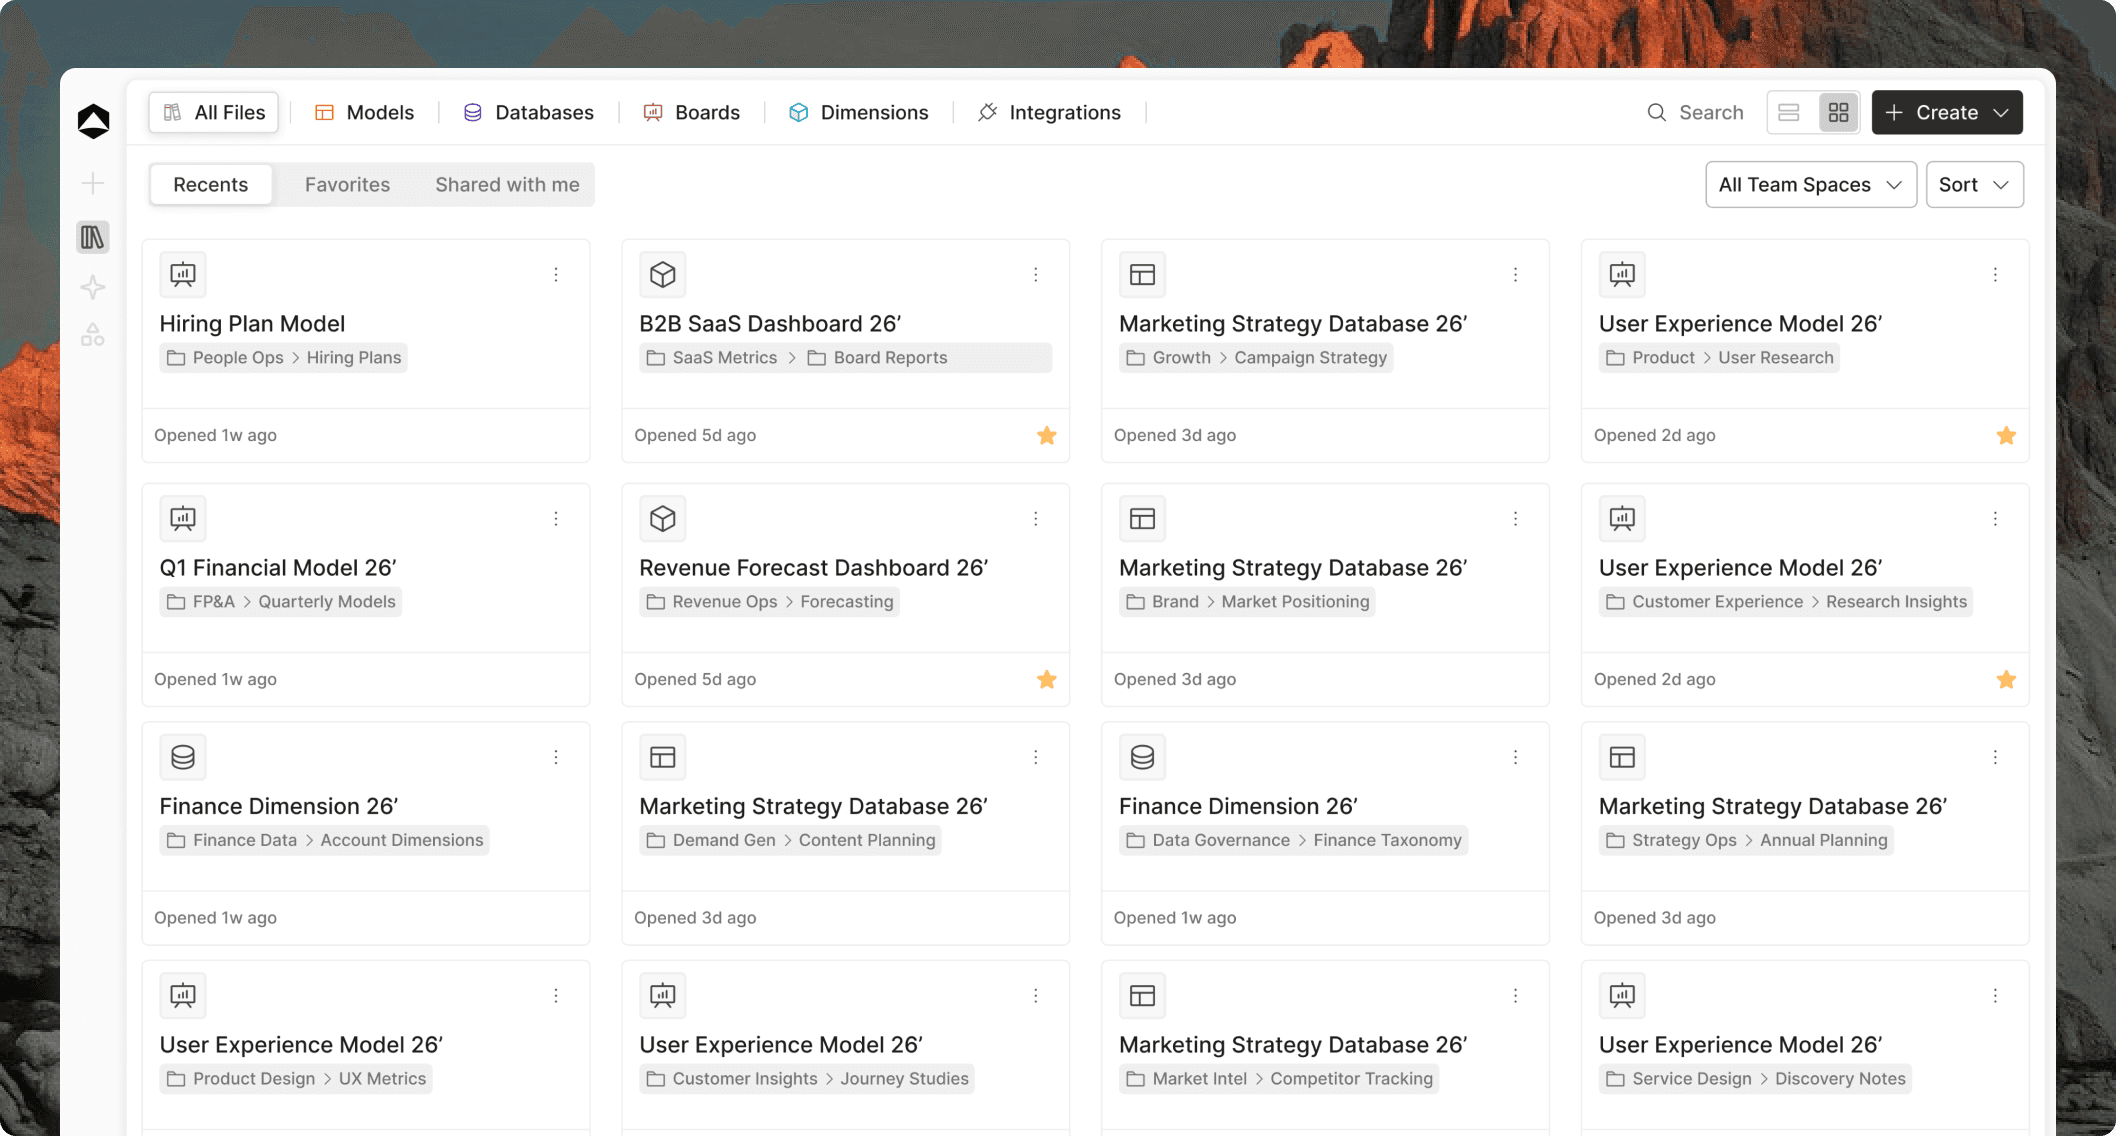
Find models, databases, boards, dimensions, and integrations from one Library. The Library brings the key parts of your workspace together, so you can browse by type, search, filter, and choose the view that suits the way you work.
Find your way around
Browse All files or go straight to Models, Databases, Boards, Dimensions, or Integrations
Search across items, filter by teamspace, and sort to bring relevant work forward
Switch between list view for scanning details and grid view for visual browsing
Get to Recent, Favorites, and Shared with me from All files
Create an item from the current tab with actions tailored to that object type
Keep your tab, search, sort, teamspace, and view reflected in the URL, so your place is easy to revisit or share
v0.3.3
Oct 5, 2026
A redesigned formula editor
Formulas sit at the center of a financial model, but editing them can become difficult as expressions grow and include several references. The formula editor has been redesigned to make the writing experience clearer and more predictable.
The new editor provides more room to work and a cleaner visual structure for building and revising model logic.
v0.3.2
Oct 2, 2026
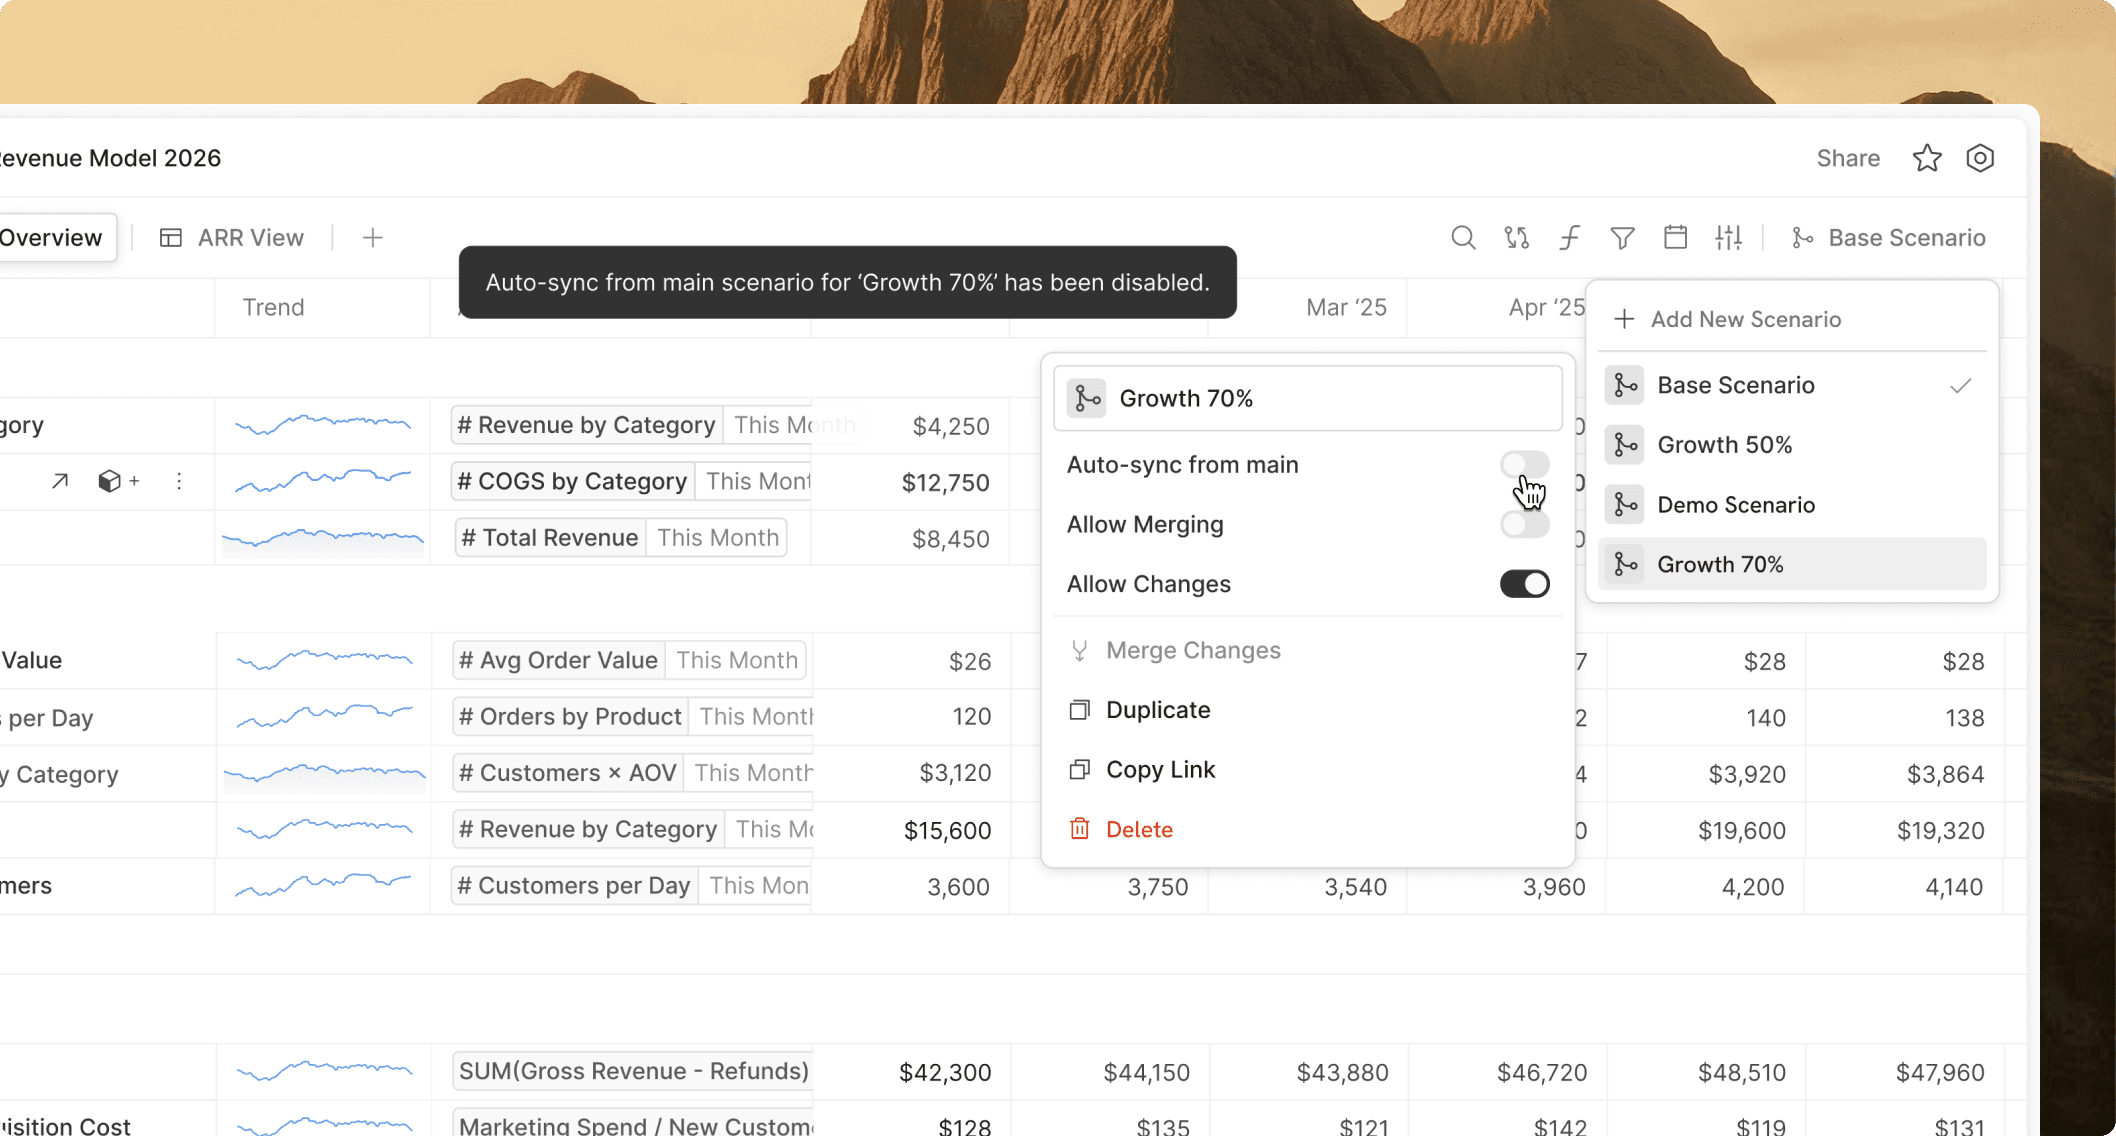
Auto-sync scenarios from the main plan
Keep scenarios aligned with Main without overwriting local changes
Scenarios are often created before Main Scenario is fully settled. Without inheritance, they become stale as the baseline changes; with indiscriminate syncing, local scenario assumptions could be lost.
Auto-sync from Main keeps eligible inherited values current while ensuring local overrides continue to win.
v0.3.1
Oct 1, 2026
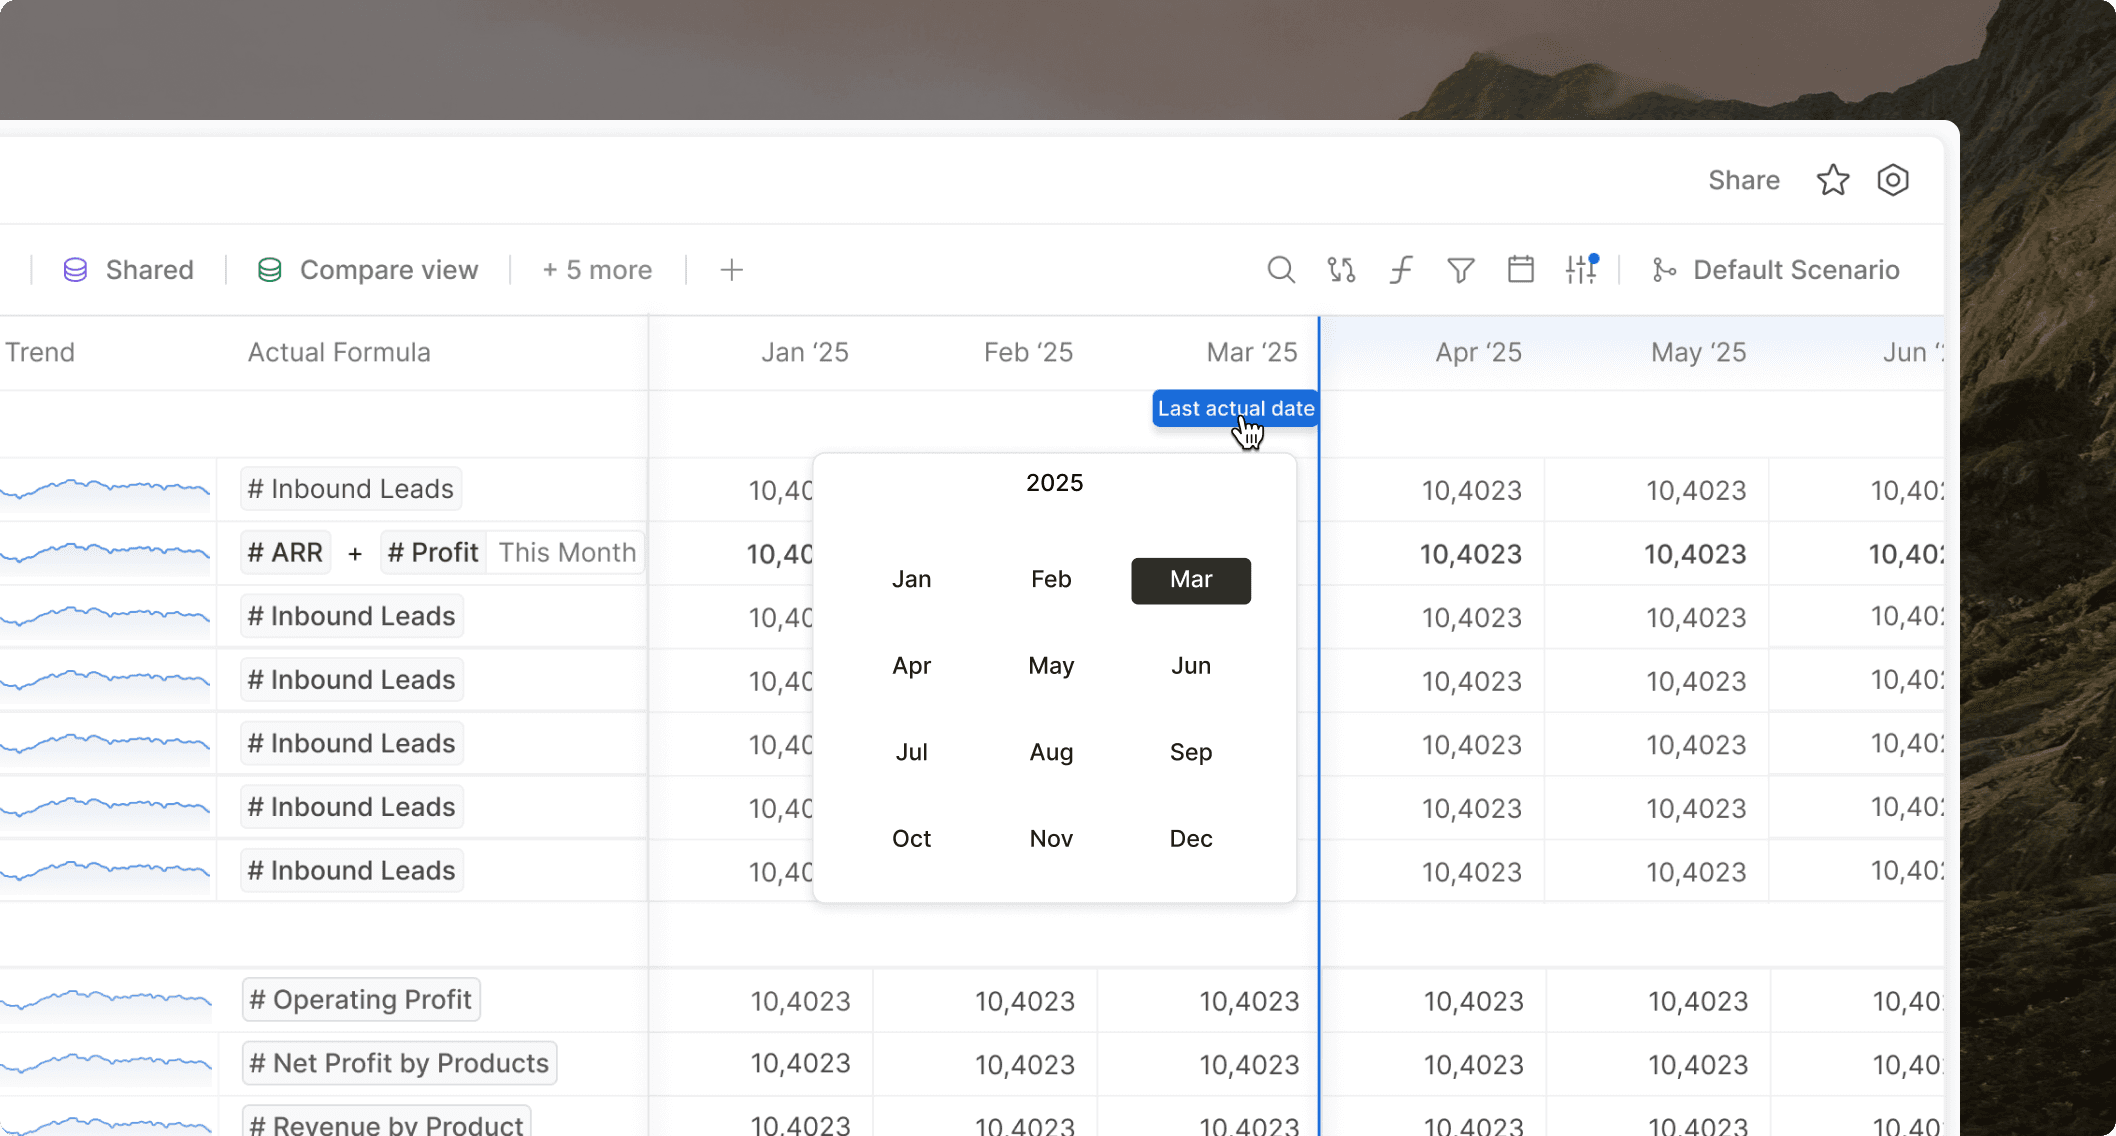
Update the last actual date across every linked model
At every close, finance teams move the boundary between actual results and forecast periods. When several models share the same planning timeline, updating that boundary one model at a time creates repetitive work and the risk of inconsistent reporting.
Oculon will provide an option to change the last-actual date across linked models together.
v0.2.15
Sep 25, 2026
Link dimensions across multiple data sources
The same business dimension often exists in several systems. Departments may appear in both accounting and HR data; regions may exist in CRM and billing; products may be represented differently across operational tools.
A dimension can now be linked to multiple data sources, giving models and databases one consistent structure across connected systems.
v0.2.14
Sep 24, 2026
Govern, merge, and delete scenarios
Scenario planning should support experimentation without leaving teams with disconnected copies or unclear authority. Once a scenario has been reviewed, teams need a controlled way to move its changes into another scenario or the main plan.
Oculon now supports explicit scenario merging together with governance, access, locking, and deletion controls.
What’s new
Merge scenario-specific overrides into another scenario
Use Main Scenario as the primary destination for reviewed changes
Confirm the source and destination before a merge runs
Merge only local overrides rather than copying the entire scenario state
Apply scenario access and governance controls
Lock approved scenarios against unwanted changes
Let administrators permanently delete obsolete non-main scenarios
Keep Main Scenario protected from deletion planning scenarios side by side
v0.2.13
Sep 22, 2026
Analyze scenarios side by side without rebuilding comparison logic.
A financial result has more meaning when viewed alongside alternative plans. Finance teams need to understand how one scenario differs from another and how those differences affect key outcomes.
Oculon now brings scenario comparison directly into models, charts, and dashboard cards.
What’s new
Compare planning scenarios side by side
Compare values against another scenario or planning case
Surface variances between scenarios
Add scenario comparison context to charts and dashboard cards
Scenario comparison controls are available directly on dashboard cards
v0.2.12
Aug 17, 2026
Access your AI chat history from the sidebar
Return to previous planning and analysis conversations with their context intact.
AI work rarely ends in one message. A useful conversation may contain assumptions, analysis, decisions, and follow-up questions that need to be revisited later.
Your Oculon AI chat history is now accessible from the application sidebar, making previous conversations easier to find and continue.
What’s new
Open AI chat history from a dedicated sidebar tab
Browse previous conversations without leaving your current workspace
Return to an earlier thread in one click
Continue working with the context already captured in that conversation
v0.2.11
Aug 15, 2026
Link queries to databases and track their status
Keep data lineage and freshness visible where the data is used.
A database is only dependable when you know where its data came from and whether it is current. You can now link an integration query directly from a database view and see the state of that connection in context.
This creates a clearer path from connected source data to the databases used for financial analysis.
What’s new
Link an existing query directly from a user database view
Use query results as the connected source for the database
See the linked query associated with an integration database
Check the current sync state without leaving the database
v0.2.10
Aug 14, 2026
Add live model, database, and dimension tables to dashboards
Keep headline charts and supporting detail together on the same review page.
Dashboards often need to do two jobs: communicate the headline and provide enough detail for someone to understand it. Charts and summary cards show the story, but finance reviews frequently move back to the underlying model or database to inspect the numbers.
You can now place live model, database, and dimension tables directly inside an Oculon dashboard.
What’s new
Insert a model table into a dashboard
Insert a database table into a dashboard
Add a dimension table for detailed breakdowns
Combine live tables with charts, cards, and explanatory content
Keep model and database outputs connected to their source
v0.2.9
Aug 13, 2026
Add columns, formulas, filters, and time-series views to databases
Oculon databases now go beyond storing rows. Add structured columns, organize large datasets, calculate new metrics, and analyze how values change over time—all from the database view.
Finance teams can shape incoming data for the question at hand without rebuilding the source or moving the analysis into another tool.
What’s new
Add variable, dimension, and text columns to a database
Set columns as time, variable, or dimension fields
Sort rows by the values that matter
Filter a database to the relevant period, entity, category, or condition
Group records around a shared business dimension
Create calculated variables with formulas inside a database
View database values as a time series
Choose how time-based variables aggregate across periods
v0.2.8
Aug 12, 2026
Find any model, dashboard, or database with ⌘K
Jump directly to the right file without navigating through folders and teamspaces.
As an Oculon workspace grows, remembering where every model, dashboard, and database lives becomes unnecessary overhead. Global search provides one keyboard-first entry point from anywhere in the application.
Press ⌘ K on Mac or Ctrl K on Windows, type part of a file name, and open the right result without leaving your current flow.
What’s new
Open global search from anywhere with
⌘ KorCtrl KSearch models, dashboards, and databases by name
Find results with plain-text or fuzzy matching
See file type and location for similarly named results
Move through results with the arrow keys
Press Enter to open a result and Escape to close search
Respect existing workspace permissions in search results
v0.2.7
Aug 3, 2026
Control which scenarios can be merged
Let teams explore alternatives without giving every scenario authority to change the shared plan.
A scenario can be useful for exploration without being ready to influence the main plan. Teams need a clear boundary between the freedom to model an alternative and the authority to merge it into a shared baseline.
What’s new
Enable or disable Allow Merging for each scenario
Prevent a scenario from initiating a merge when the control is off
Keep editing rights separate from merge rights
Make unavailable merge actions clear in the interface
Apply merge eligibility consistently across product and automated workflows
v0.2.6
Jul 31, 2026
Color-code variable rows to scan models faster
Use color to distinguish assumptions, calculations, subtotals, and key outputs.
Large financial models contain different kinds of information: assumptions, calculations, subtotals, and final outputs. When every row looks the same, reviewers have to inspect each label or formula before understanding how the model is organized.
Variable row colors let you create a visual language for the model and draw attention to the lines that matter.
What’s new
Apply a color to any variable row
Visually distinguish assumptions from calculated values
Highlight subtotals, outputs, and key drivers
Use consistent row styling across a model
v0.2.5
Aug 1, 2026
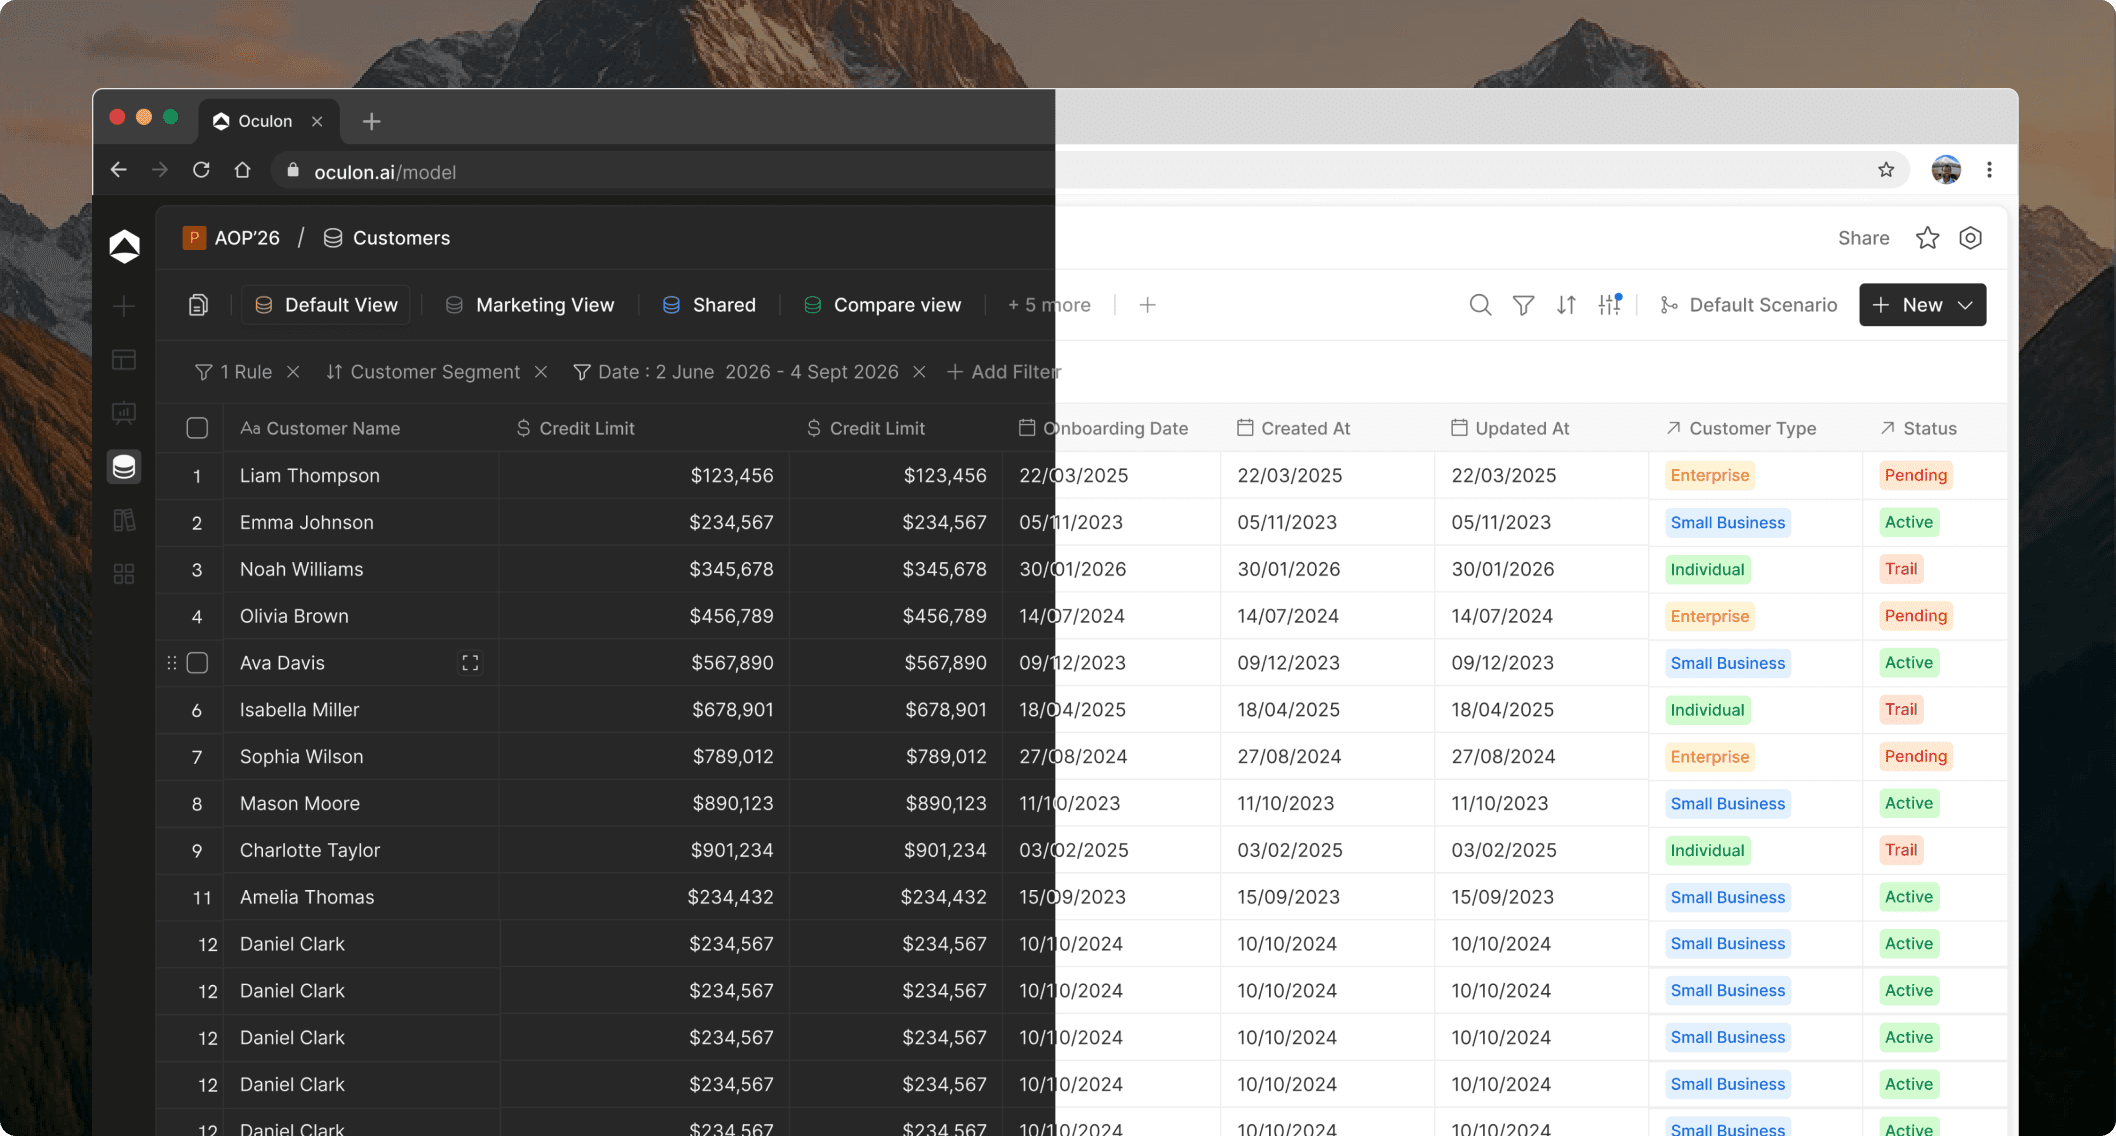
Switch Oculon to dark mode
Use a consistent dark theme across models, dashboards, databases, and AI chat.
Oculon now includes a complete dark theme across the application. Switch between light and dark mode based on your environment or preference. Once selected, Oculon remembers the setting across sessions.
v0.2.3
Aug 6, 2026
See how revenue, expenses, headcount, and other metrics change without adding extra formulas.
Understanding a number often requires more than seeing its current value. You need to know how it compares with the previous month, quarter, or year.
Time comparisons let you compare values with an earlier period directly inside a model, without creating additional formulas or manually maintaining comparison rows.
What’s new
Compare a value against an earlier time period
Surface period-over-period movement within the model
Reuse the same comparison logic across changing dates
Reduce the number of supporting formulas needed for variance analysis
v0.2.2
Jul 23, 2026
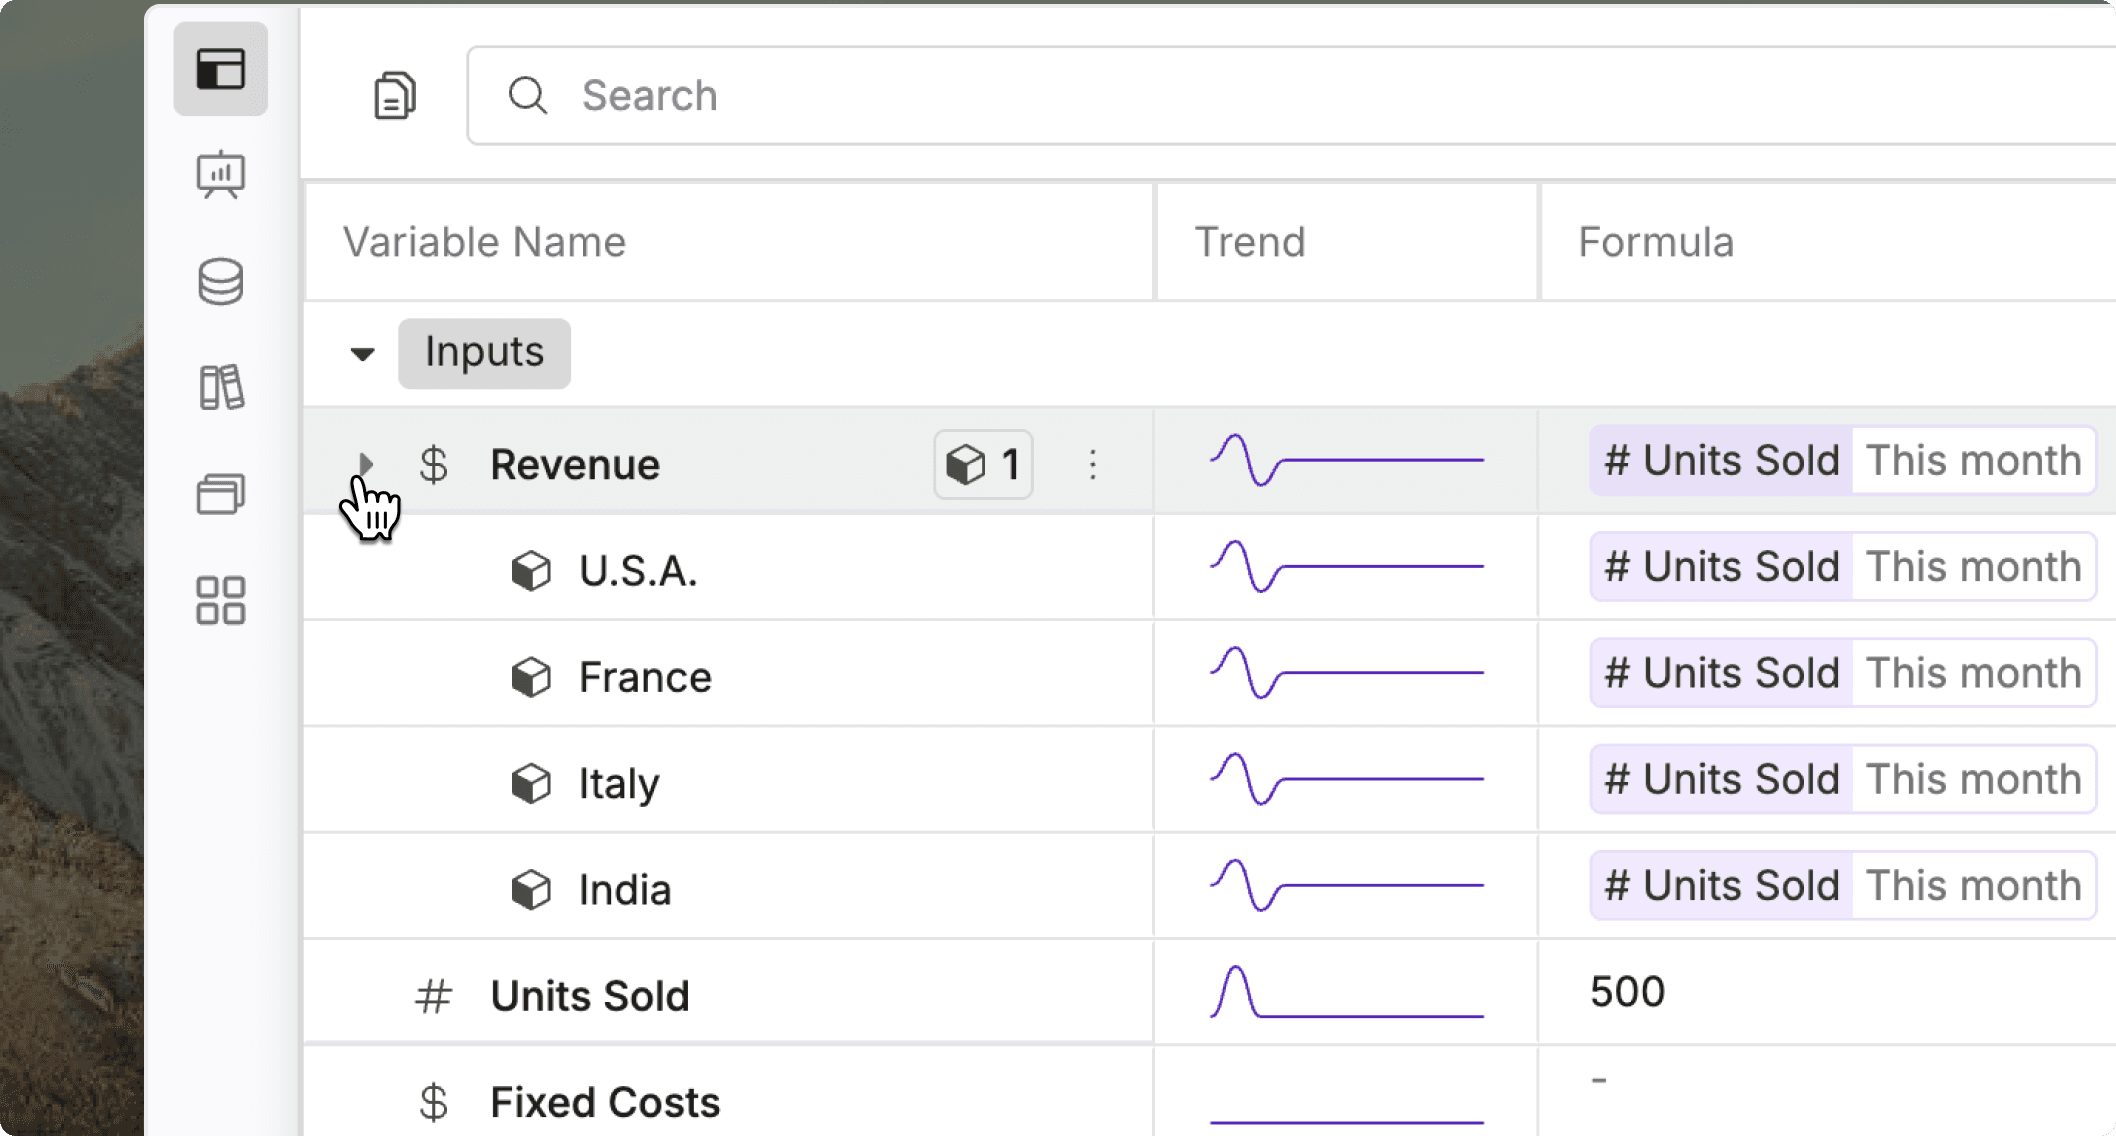
Create dimension-based variables without duplicating rows
Many financial metrics need to be planned across a business dimension: revenue by product, headcount by department, expenses by entity, or customers by region.
Dimension-based variables let you create one variable and automatically expand it across the members of a selected dimension. You get the detail needed for planning and analysis without manually creating and maintaining a separate row for every combination.
What’s new
Create a variable driven by a dimension
Break a metric out across every member of that dimension
Add dimension members without manually rebuilding the model structure
Keep detailed models compact and easier to maintain
v0.2.4
Jul 27, 2026
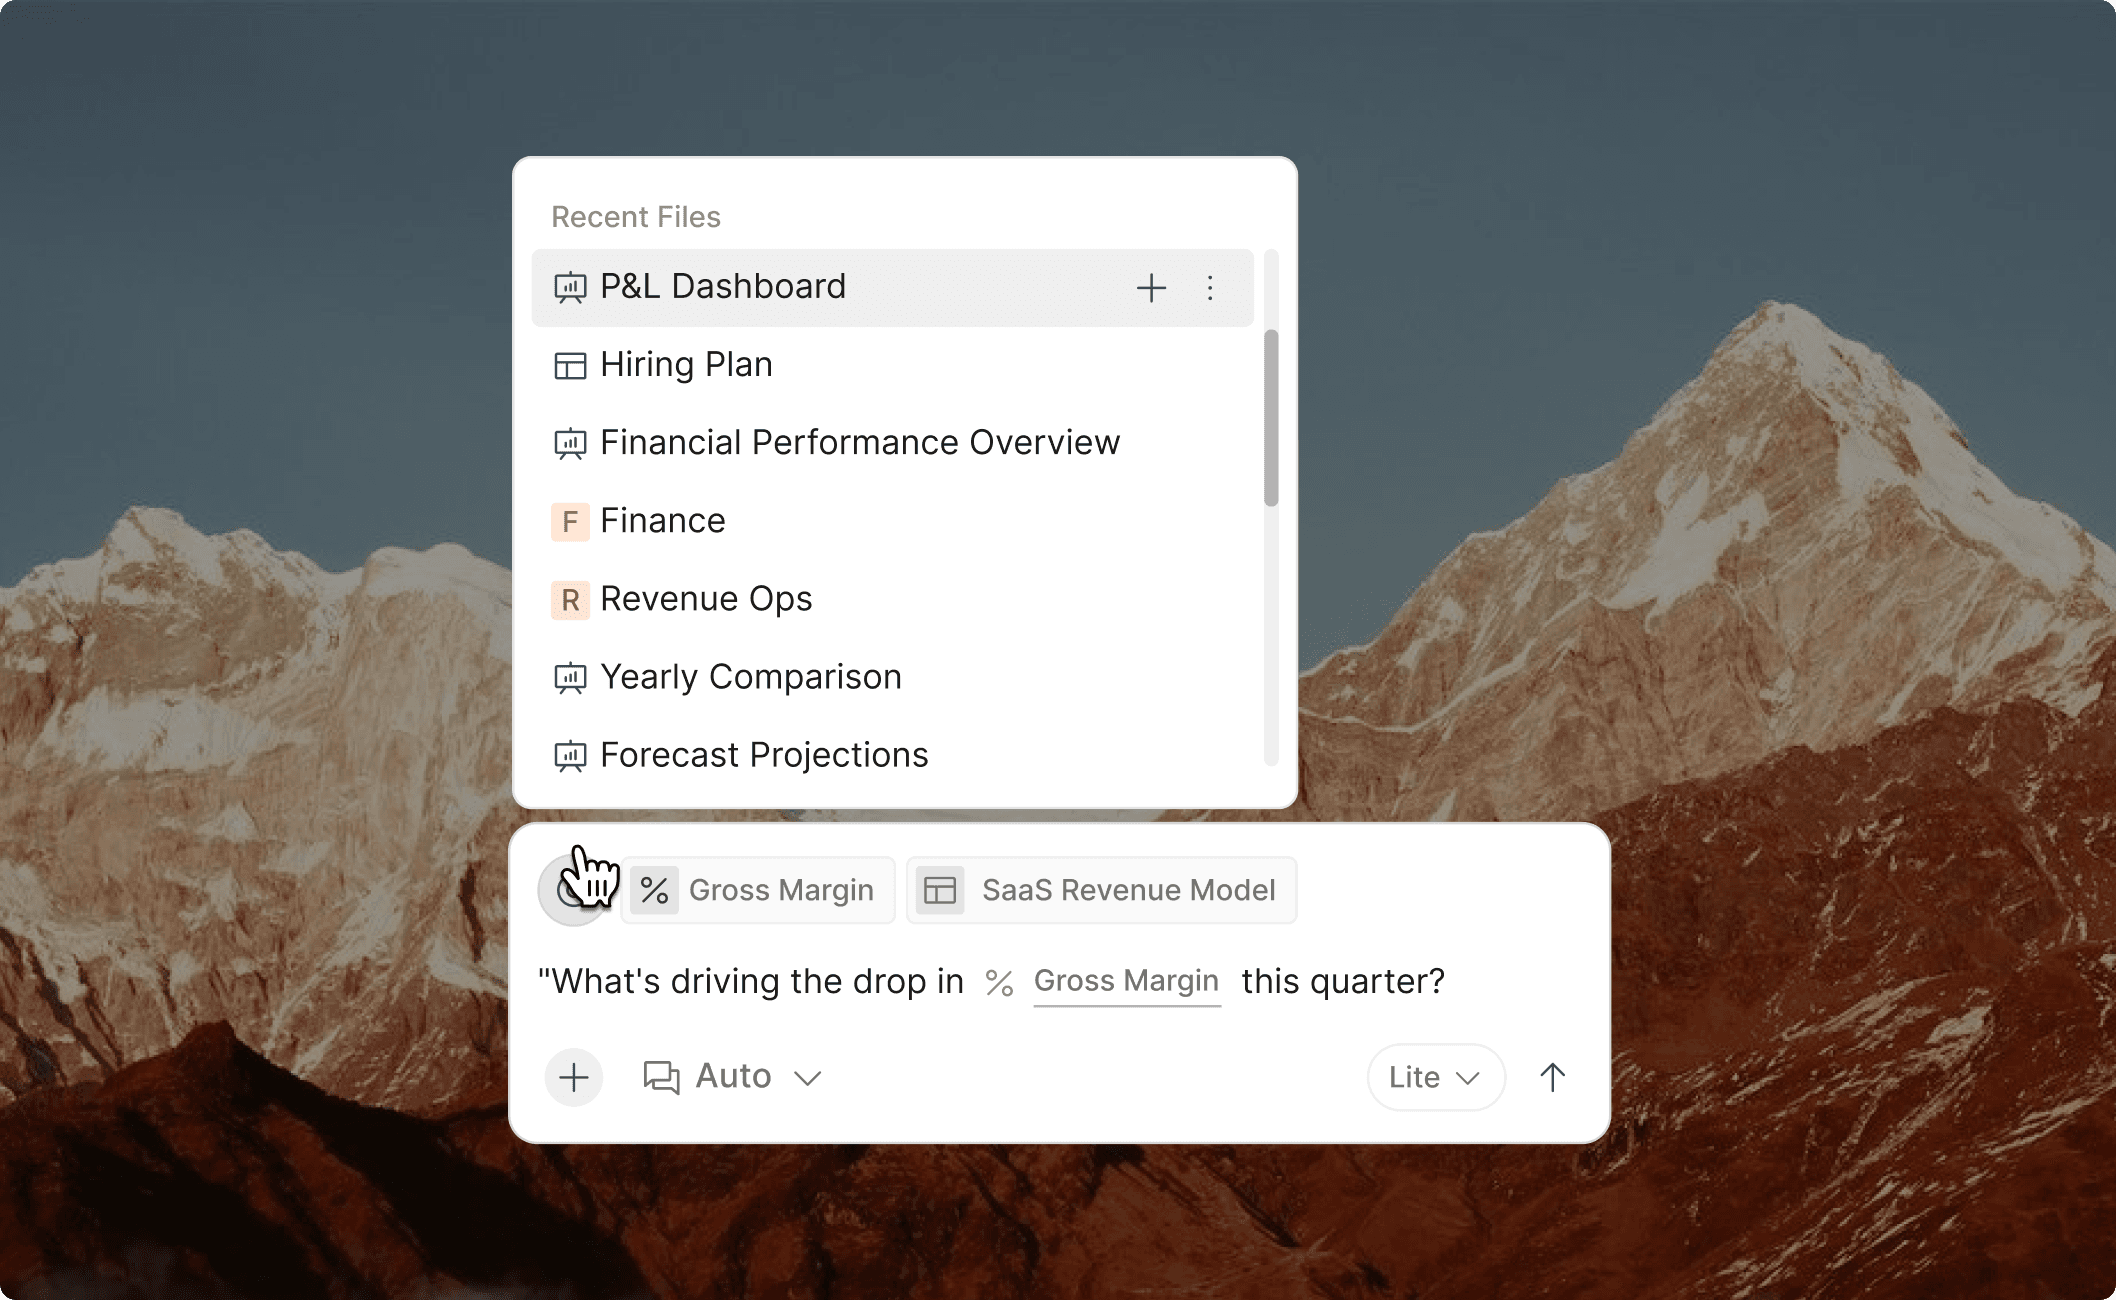
Reference models, dashboards, and databases with @mentions
AI responses are more reliable when the relevant context is explicit. Use @ mentions in AI chat to reference specific Oculon files and spaces.
Instead of asking AI to infer which model or dashboard you mean, point it directly to the source it should read.
What’s new
Mention a model in AI chat
Reference a dashboard
Reference a database
Reference an Oculon space
Ground responses in the selected workspace context
v0.2.1
Jul 25, 2026
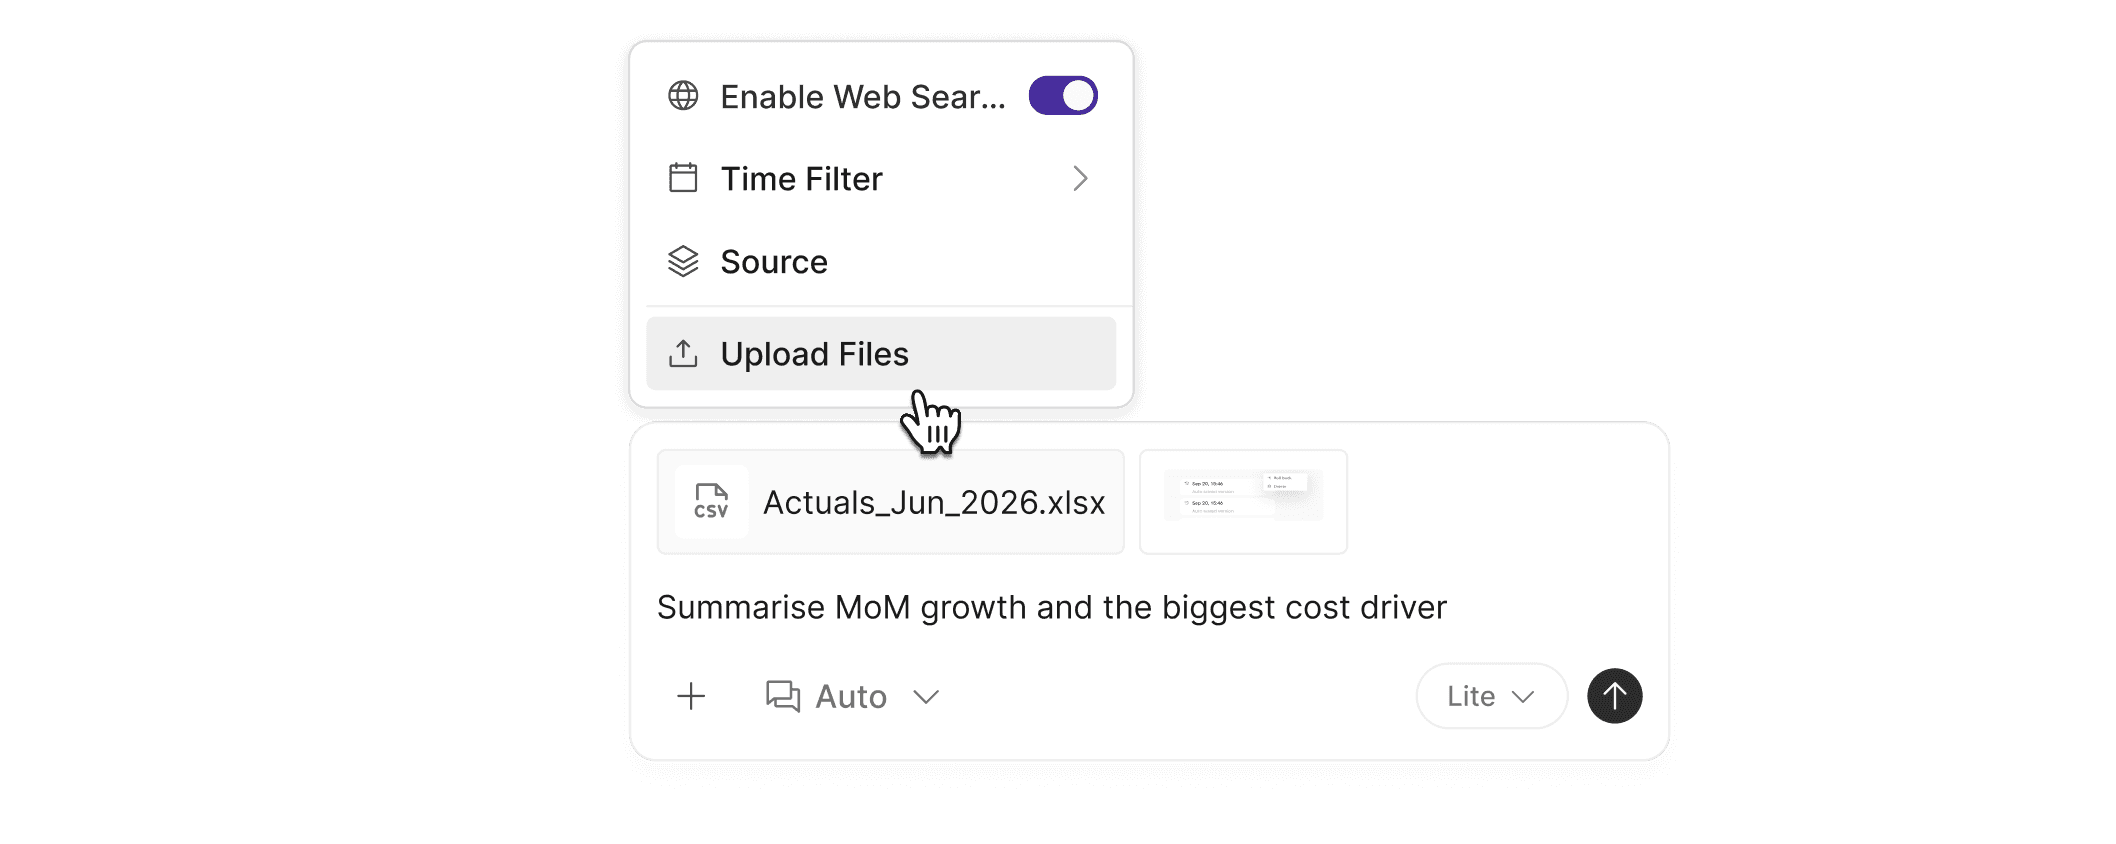
Attach images, CSVs, Excel and PDFs in AI chat
Financial work often begins with a spreadsheet, report, screenshot, or PDF. Instead of manually transferring that information or describing it in a prompt, attach the source material directly to Oculon AI chat.
Oculon can read the attachment, use its contents as context, answer questions about it, and help turn the underlying information into structured analysis or models.
What’s new
Attach images to an AI conversation
Upload and analyze CSV files
Work with Excel spreadsheets
Read and analyze PDFs
Use attached files as context for answers and model-building
v0.1.4
Jul 21, 2026
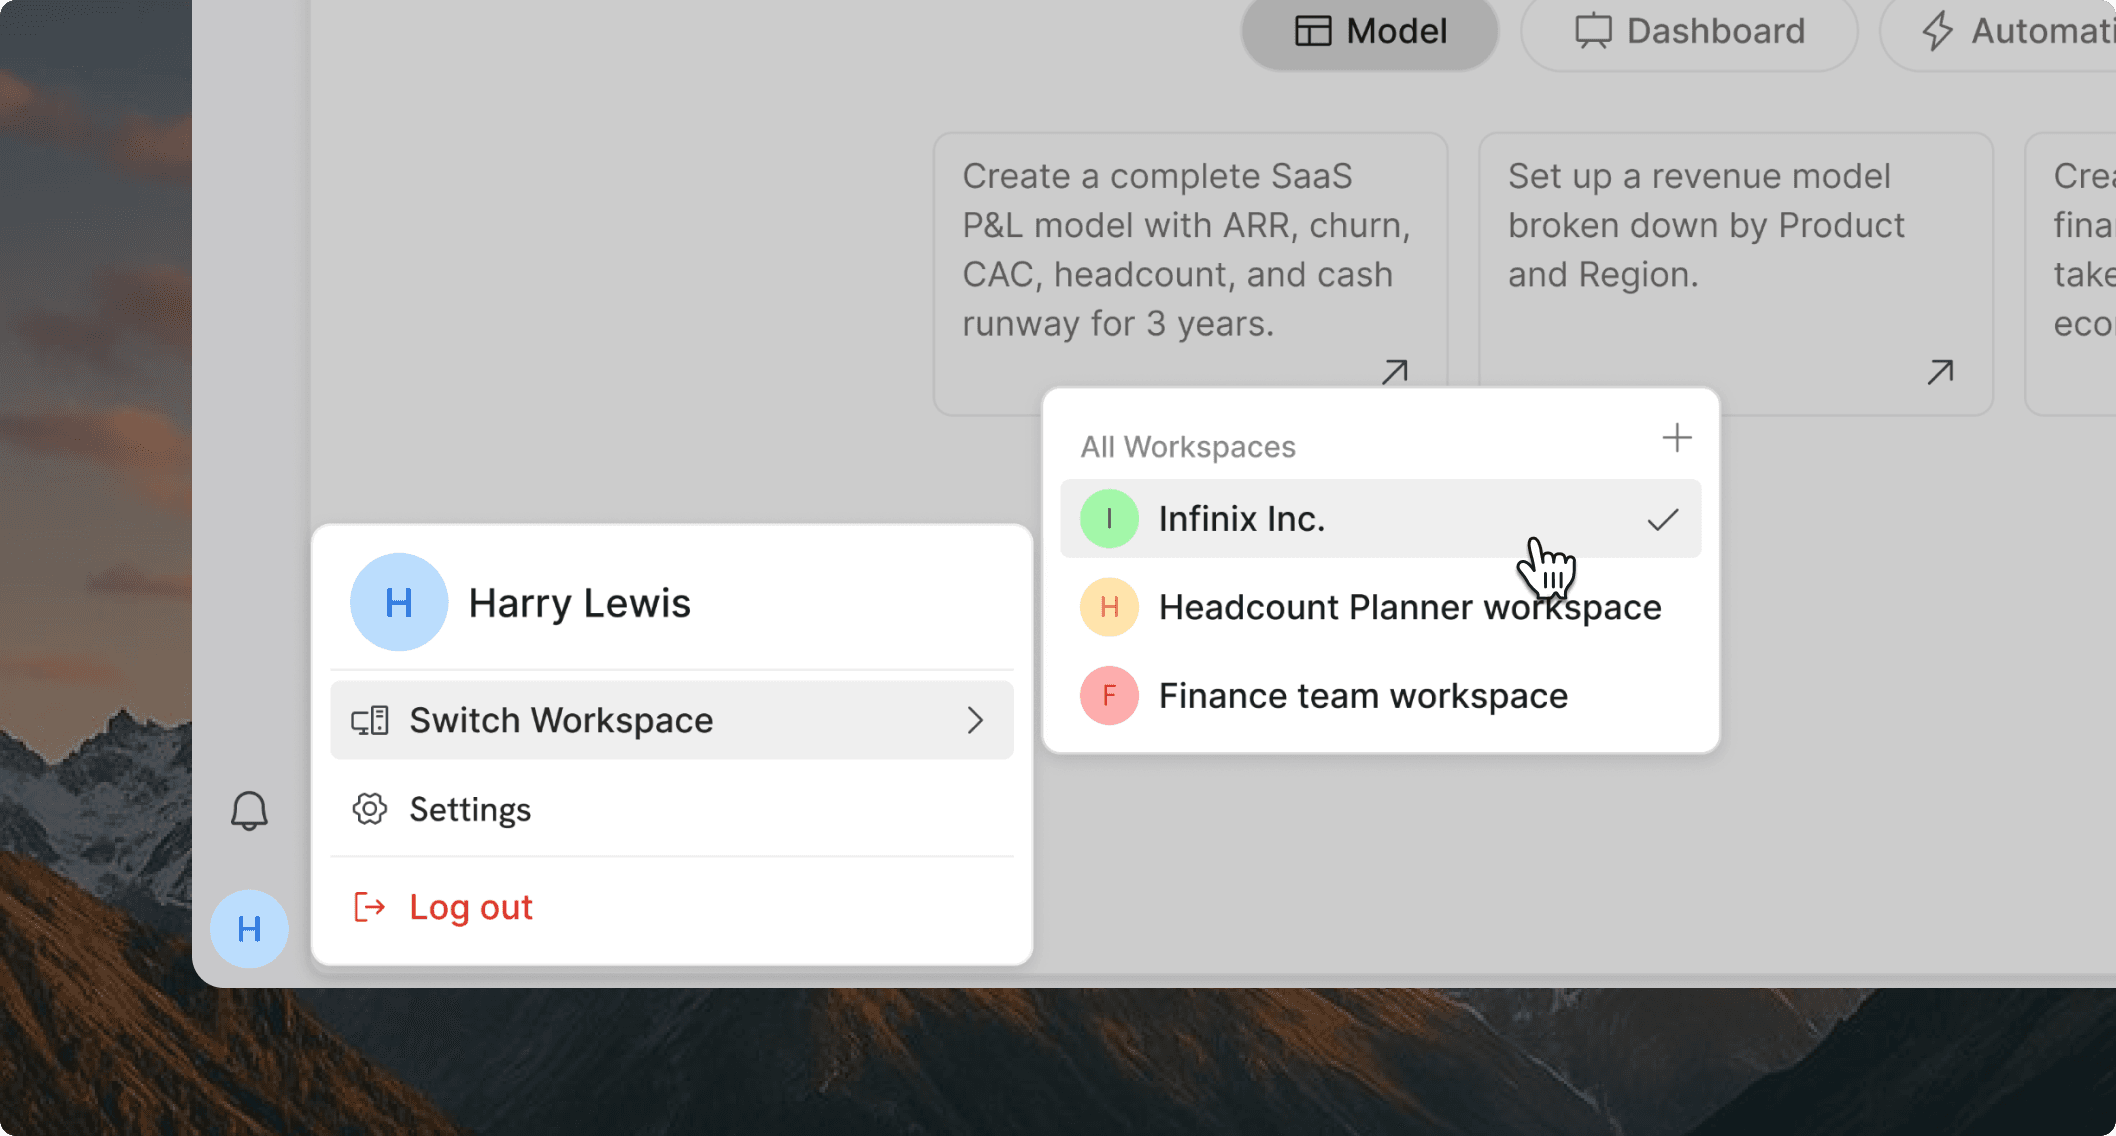
Create separate workspaces for entities, teams, and clients
You can now create and manage multiple Oculon workspaces, keeping each environment cleanly separated while making it easy to move between them.
What’s new
Create multiple workspaces
Switch between workspaces
Manage each workspace independently
Keep data, models, dashboards, and members separated by workspace
This gives organizations room to grow without forcing unrelated planning work into one shared environment.
v0.1.3
Jul 21, 2026
Manage teamspaces, roles, and permissions with confidence
Not every model, dashboard, or database should be visible to everyone. Oculon now gives administrators a structured way to organize people into teamspaces and manage access through roles and permissions.
Create teamspaces for groups such as Finance, Revenue, People, or individual business units. Each teamspace provides a dedicated area for the models, dashboards, databases, and documents relevant to that team.
What's new
Central administration for teamspaces
User roles and permissions
Teamspace settings
Space-level access controls
v0.1.2
Jul 17, 2026
Format variables and filter dashboard cards for clearer reporting
Present numbers consistently and focus each card on the period, dimension, and scenario that matters.
Financial information is easier to understand when numbers are presented consistently and reporting views show only what matters. This release adds variable formatting and more control over the information displayed in dashboard cards.
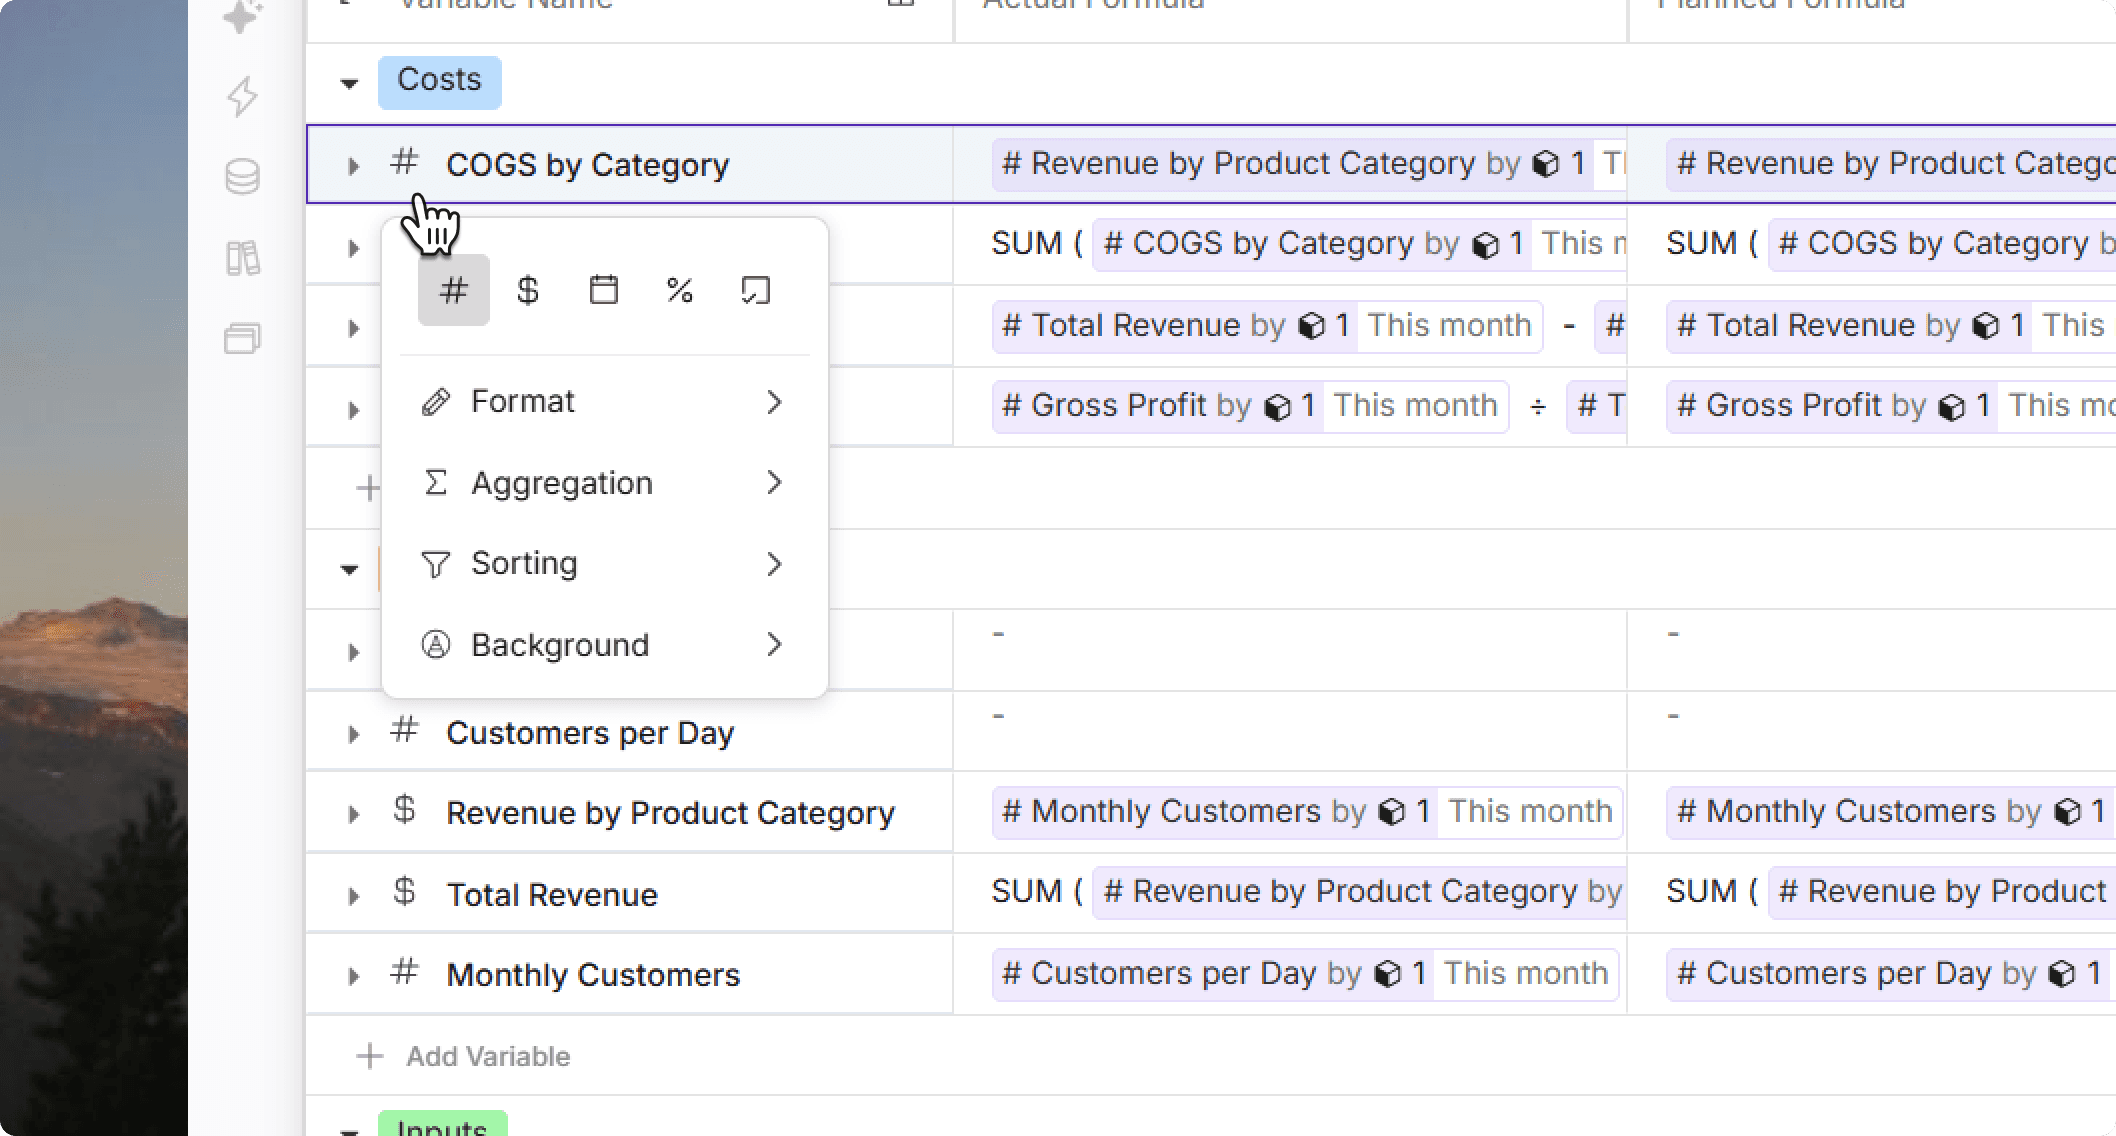
Format variables for their financial meaning
Control how variables appear so percentages, currencies, counts, and other metrics are immediately recognizable. Reviewers can interpret values correctly without relying on row names or additional explanations.
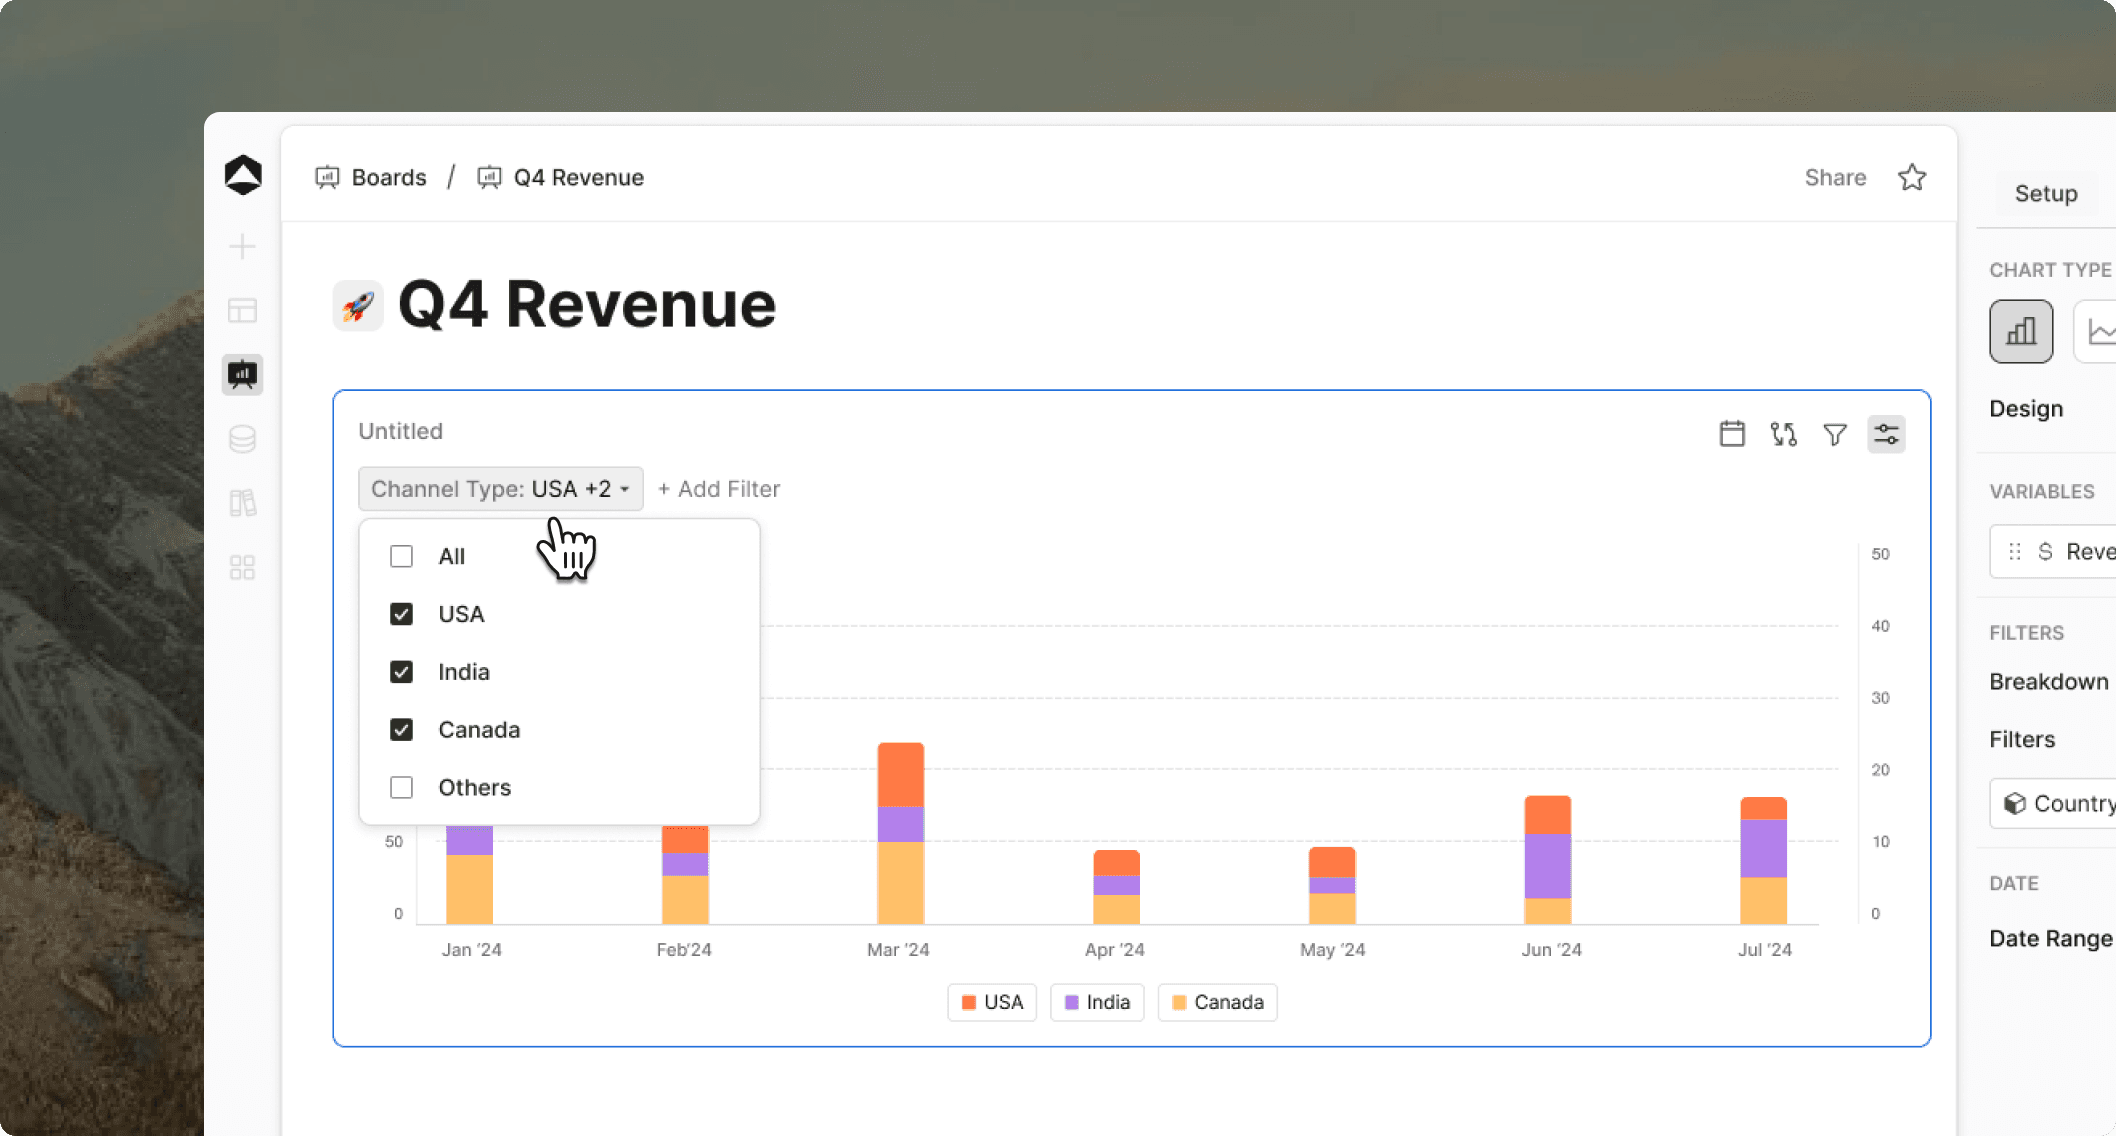
Focus dashboard cards on the right context
Filter dashboard cards by date, dimension, and scenario. A single dashboard can show the appropriate period, entity, department, product, or planning scenario without duplicating the underlying analysis.
What’s new
Apply number and display formatting to variables
Filter dashboard cards by date
Filter cards by dimension
Filter cards by scenario
v0.1.1
Jul 20, 2026
Organize variables into sections with drag-and-drop
Group and reorder related variables so large models are easier to navigate and review.
As models grow, related assumptions and calculations become harder to find. Variables can now be grouped into named sections and reordered with drag-and-drop, making a model easier to navigate, review, and explain.
What's new
Group related variables into named sections
Reorder variables within a section
Reorder complete sections
Structure models around business areas, operating drivers, or calculation stages
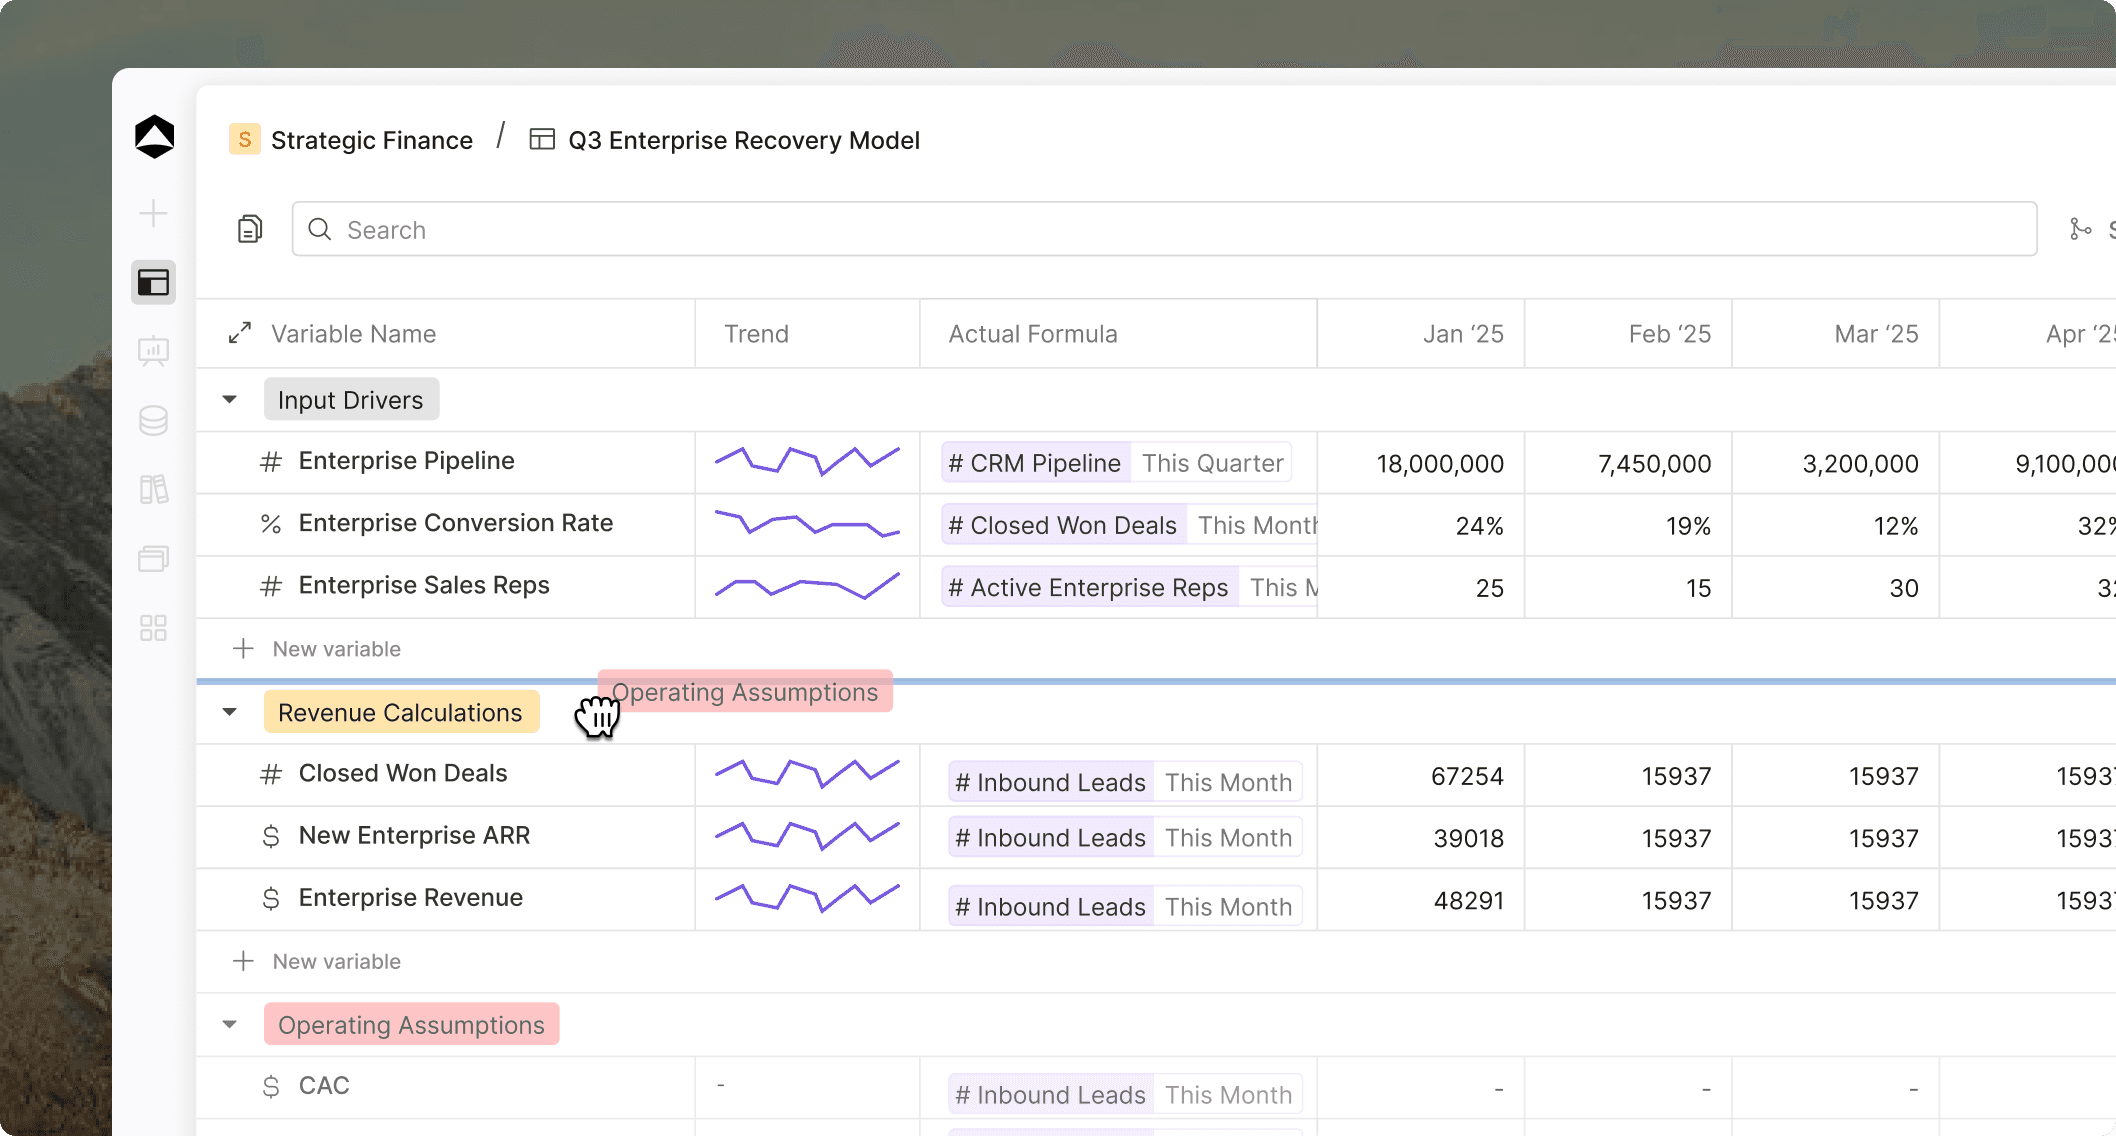
For example, a revenue model can keep pricing, customer volume, retention, and expansion assumptions in separate sections—without splitting them into different models.
v0.1.0
Jul 1, 2026
The core Oculon app: build models, dashboards & databases
The one that started it all. 0.1.0 is the foundation of Oculon, an AI-native finance workspace where you model, analyze, and report in one place. Build driver-based models, connect your data, and turn it into dashboards your whole team can read.
Modeling & Planning
Build models on a structured system of variables and dimensions, then write formulas with overrides and clean actuals vs. plan separation. Link dimensions across models with time/dimension aggregation, and organize models with ranges, sections, and a last-actual date.
Dashboards & Reporting
Turn models into readable dashboards using cards, charts, and rich text. Configure bar/line charts with flexible display, axes, and selectors.
Database
Create databases from scratch or directly from a query, map dimensions into them, and manage data through list + detail views.
Integrations
Connect external data sources, explore them in a query editor, and manage everything from a dedicated integrations page.
Collaboration & Governance
A shared workspace with sidebar/onboarding/auth, plus sharing for models/boards/databases with user management and teamspaces.
v0.3.6
Oct 16, 2026
Linked and helper variables
Create a variable once. Use it everywhere — it stays one thing.
Until now, reusing a business assumption across models meant recreating it. Headcount in the workforce plan, the opex model, and the P&L; an ARR target in the revenue model and the board plan. Every copy drifts, and updating an assumption means hunting down every duplicate.
You can return to an earlier checkpoint without deleting the history that came after it.
What’s new
- Add existing variables from the Add Variable flow as live references — no separate editable/read-only choice
- Keep values, formulas, dimensions, formatting, and scenarios in sync; edits apply everywhere
- Aggregate or spread values across time granularities, with explicit dimension and scenario mapping
- See the source, access state, granularity, and warnings for changes affecting other pages
- View every placement, dependency, and downstream use in variable details
Changelog
Product updates. Improvements. Fixes.
v0.3.4
Oct 14, 2026
Dashboard page level filters
Change the reporting period or business slice without reconfiguring each card separately.
Oculon is adding page-level time and dimension filters so you can review a dashboard in one consistent context. Select a period, region, department, or another supported dimension from the filter bar at the top of the page.
v0.3.5
Oct 17, 2026
View and clear what AI chat remembers
Persistent memory can make AI more useful across conversations, but users need control over what continues to influence future responses. Oculon now provides visibility into stored memory and clear actions for removing it.
Chat history and persistent memory remain separate: clearing memory does not delete the conversation transcript.
What’s new
See how many workspace memory items are stored
Clear memory created from a specific chat
Let administrators clear all workspace memory
Confirm sensitive workspace-wide clearing before it runs
Continue using chat history without treating cleared information as persistent memory
v0.3.5
Oct 15, 2026
Find everything in the Library
Find models, databases, boards, dimensions, and integrations from one Library. The Library brings the key parts of your workspace together, so you can browse by type, search, filter, and choose the view that suits the way you work.
Find your way around
Browse All files or go straight to Models, Databases, Boards, Dimensions, or Integrations
Search across items, filter by teamspace, and sort to bring relevant work forward
Switch between list view for scanning details and grid view for visual browsing
Get to Recent, Favorites, and Shared with me from All files
Create an item from the current tab with actions tailored to that object type
Keep your tab, search, sort, teamspace, and view reflected in the URL, so your place is easy to revisit or share
v0.3.3
Oct 5, 2026
A redesigned formula editor
Formulas sit at the center of a financial model, but editing them can become difficult as expressions grow and include several references. The formula editor has been redesigned to make the writing experience clearer and more predictable.
The new editor provides more room to work and a cleaner visual structure for building and revising model logic.
v0.3.2
Oct 2, 2026
Auto-sync scenarios from the main plan
Keep scenarios aligned with Main without overwriting local changes
Scenarios are often created before Main Scenario is fully settled. Without inheritance, they become stale as the baseline changes; with indiscriminate syncing, local scenario assumptions could be lost.
Auto-sync from Main keeps eligible inherited values current while ensuring local overrides continue to win.
v0.3.1
Oct 1, 2026
Update the last actual date across every linked model
At every close, finance teams move the boundary between actual results and forecast periods. When several models share the same planning timeline, updating that boundary one model at a time creates repetitive work and the risk of inconsistent reporting.
Oculon will provide an option to change the last-actual date across linked models together.
v0.2.15
Sep 25, 2026
Link dimensions across multiple data sources
The same business dimension often exists in several systems. Departments may appear in both accounting and HR data; regions may exist in CRM and billing; products may be represented differently across operational tools.
A dimension can now be linked to multiple data sources, giving models and databases one consistent structure across connected systems.
v0.2.14
Sep 24, 2026
Govern, merge, and delete scenarios
Scenario planning should support experimentation without leaving teams with disconnected copies or unclear authority. Once a scenario has been reviewed, teams need a controlled way to move its changes into another scenario or the main plan.
Oculon now supports explicit scenario merging together with governance, access, locking, and deletion controls.
What’s new
Merge scenario-specific overrides into another scenario
Use Main Scenario as the primary destination for reviewed changes
Confirm the source and destination before a merge runs
Merge only local overrides rather than copying the entire scenario state
Apply scenario access and governance controls
Lock approved scenarios against unwanted changes
Let administrators permanently delete obsolete non-main scenarios
Keep Main Scenario protected from deletion planning scenarios side by side
v0.2.13
Sep 22, 2026
Analyze scenarios side by side without rebuilding comparison logic.
A financial result has more meaning when viewed alongside alternative plans. Finance teams need to understand how one scenario differs from another and how those differences affect key outcomes.
Oculon now brings scenario comparison directly into models, charts, and dashboard cards.
What’s new
Compare planning scenarios side by side
Compare values against another scenario or planning case
Surface variances between scenarios
Add scenario comparison context to charts and dashboard cards
Scenario comparison controls are available directly on dashboard cards
v0.2.12
Aug 17, 2026
Access your AI chat history from the sidebar
Return to previous planning and analysis conversations with their context intact.
AI work rarely ends in one message. A useful conversation may contain assumptions, analysis, decisions, and follow-up questions that need to be revisited later.
Your Oculon AI chat history is now accessible from the application sidebar, making previous conversations easier to find and continue.
What’s new
Open AI chat history from a dedicated sidebar tab
Browse previous conversations without leaving your current workspace
Return to an earlier thread in one click
Continue working with the context already captured in that conversation
v0.2.11
Aug 15, 2026
Link queries to databases and track their status
Keep data lineage and freshness visible where the data is used.
A database is only dependable when you know where its data came from and whether it is current. You can now link an integration query directly from a database view and see the state of that connection in context.
This creates a clearer path from connected source data to the databases used for financial analysis.
What’s new
Link an existing query directly from a user database view
Use query results as the connected source for the database
See the linked query associated with an integration database
Check the current sync state without leaving the database
v0.2.10
Aug 14, 2026
Add live model, database, and dimension tables to dashboards
Keep headline charts and supporting detail together on the same review page.
Dashboards often need to do two jobs: communicate the headline and provide enough detail for someone to understand it. Charts and summary cards show the story, but finance reviews frequently move back to the underlying model or database to inspect the numbers.
You can now place live model, database, and dimension tables directly inside an Oculon dashboard.
What’s new
Insert a model table into a dashboard
Insert a database table into a dashboard
Add a dimension table for detailed breakdowns
Combine live tables with charts, cards, and explanatory content
Keep model and database outputs connected to their source
v0.2.9
Aug 13, 2026
Add columns, formulas, filters, and time-series views to databases
Oculon databases now go beyond storing rows. Add structured columns, organize large datasets, calculate new metrics, and analyze how values change over time—all from the database view.
Finance teams can shape incoming data for the question at hand without rebuilding the source or moving the analysis into another tool.
What’s new
Add variable, dimension, and text columns to a database
Set columns as time, variable, or dimension fields
Sort rows by the values that matter
Filter a database to the relevant period, entity, category, or condition
Group records around a shared business dimension
Create calculated variables with formulas inside a database
View database values as a time series
Choose how time-based variables aggregate across periods
v0.2.8
Aug 12, 2026
Find any model, dashboard, or database with ⌘K
Jump directly to the right file without navigating through folders and teamspaces.
As an Oculon workspace grows, remembering where every model, dashboard, and database lives becomes unnecessary overhead. Global search provides one keyboard-first entry point from anywhere in the application.
Press ⌘ K on Mac or Ctrl K on Windows, type part of a file name, and open the right result without leaving your current flow.
What’s new
Open global search from anywhere with
⌘ KorCtrl KSearch models, dashboards, and databases by name
Find results with plain-text or fuzzy matching
See file type and location for similarly named results
Move through results with the arrow keys
Press Enter to open a result and Escape to close search
Respect existing workspace permissions in search results
v0.2.7
Aug 3, 2026
Control which scenarios can be merged
Let teams explore alternatives without giving every scenario authority to change the shared plan.
A scenario can be useful for exploration without being ready to influence the main plan. Teams need a clear boundary between the freedom to model an alternative and the authority to merge it into a shared baseline.
What’s new
Enable or disable Allow Merging for each scenario
Prevent a scenario from initiating a merge when the control is off
Keep editing rights separate from merge rights
Make unavailable merge actions clear in the interface
Apply merge eligibility consistently across product and automated workflows
v0.2.6
Jul 31, 2026
Color-code variable rows to scan models faster
Use color to distinguish assumptions, calculations, subtotals, and key outputs.
Large financial models contain different kinds of information: assumptions, calculations, subtotals, and final outputs. When every row looks the same, reviewers have to inspect each label or formula before understanding how the model is organized.
Variable row colors let you create a visual language for the model and draw attention to the lines that matter.
What’s new
Apply a color to any variable row
Visually distinguish assumptions from calculated values
Highlight subtotals, outputs, and key drivers
Use consistent row styling across a model
v0.2.5
Aug 1, 2026
Switch Oculon to dark mode
Use a consistent dark theme across models, dashboards, databases, and AI chat.
Oculon now includes a complete dark theme across the application. Switch between light and dark mode based on your environment or preference. Once selected, Oculon remembers the setting across sessions.
v0.2.3
Aug 6, 2026
See how revenue, expenses, headcount, and other metrics change without adding extra formulas.
Understanding a number often requires more than seeing its current value. You need to know how it compares with the previous month, quarter, or year.
Time comparisons let you compare values with an earlier period directly inside a model, without creating additional formulas or manually maintaining comparison rows.
What’s new
Compare a value against an earlier time period
Surface period-over-period movement within the model
Reuse the same comparison logic across changing dates
Reduce the number of supporting formulas needed for variance analysis
v0.2.2
Jul 23, 2026
Create dimension-based variables without duplicating rows
Many financial metrics need to be planned across a business dimension: revenue by product, headcount by department, expenses by entity, or customers by region.
Dimension-based variables let you create one variable and automatically expand it across the members of a selected dimension. You get the detail needed for planning and analysis without manually creating and maintaining a separate row for every combination.
What’s new
Create a variable driven by a dimension
Break a metric out across every member of that dimension
Add dimension members without manually rebuilding the model structure
Keep detailed models compact and easier to maintain
v0.2.4
Jul 27, 2026
Reference models, dashboards, and databases with @mentions
AI responses are more reliable when the relevant context is explicit. Use @ mentions in AI chat to reference specific Oculon files and spaces.
Instead of asking AI to infer which model or dashboard you mean, point it directly to the source it should read.
What’s new
Mention a model in AI chat
Reference a dashboard
Reference a database
Reference an Oculon space
Ground responses in the selected workspace context
v0.2.1
Jul 25, 2026
Attach images, CSVs, Excel and PDFs in AI chat
Financial work often begins with a spreadsheet, report, screenshot, or PDF. Instead of manually transferring that information or describing it in a prompt, attach the source material directly to Oculon AI chat.
Oculon can read the attachment, use its contents as context, answer questions about it, and help turn the underlying information into structured analysis or models.
What’s new
Attach images to an AI conversation
Upload and analyze CSV files
Work with Excel spreadsheets
Read and analyze PDFs
Use attached files as context for answers and model-building
v0.1.4
Jul 21, 2026
Create separate workspaces for entities, teams, and clients
You can now create and manage multiple Oculon workspaces, keeping each environment cleanly separated while making it easy to move between them.
What’s new
Create multiple workspaces
Switch between workspaces
Manage each workspace independently
Keep data, models, dashboards, and members separated by workspace
This gives organizations room to grow without forcing unrelated planning work into one shared environment.
v0.1.3
Jul 21, 2026
Manage teamspaces, roles, and permissions with confidence
Not every model, dashboard, or database should be visible to everyone. Oculon now gives administrators a structured way to organize people into teamspaces and manage access through roles and permissions.
Create teamspaces for groups such as Finance, Revenue, People, or individual business units. Each teamspace provides a dedicated area for the models, dashboards, databases, and documents relevant to that team.
What's new
Central administration for teamspaces
User roles and permissions
Teamspace settings
Space-level access controls
v0.1.2
Jul 17, 2026
Format variables and filter dashboard cards for clearer reporting
Present numbers consistently and focus each card on the period, dimension, and scenario that matters.
Financial information is easier to understand when numbers are presented consistently and reporting views show only what matters. This release adds variable formatting and more control over the information displayed in dashboard cards.
Format variables for their financial meaning
Control how variables appear so percentages, currencies, counts, and other metrics are immediately recognizable. Reviewers can interpret values correctly without relying on row names or additional explanations.
Focus dashboard cards on the right context
Filter dashboard cards by date, dimension, and scenario. A single dashboard can show the appropriate period, entity, department, product, or planning scenario without duplicating the underlying analysis.
What’s new
Apply number and display formatting to variables
Filter dashboard cards by date
Filter cards by dimension
Filter cards by scenario
v0.1.1
Jul 20, 2026
Organize variables into sections with drag-and-drop
Group and reorder related variables so large models are easier to navigate and review.
As models grow, related assumptions and calculations become harder to find. Variables can now be grouped into named sections and reordered with drag-and-drop, making a model easier to navigate, review, and explain.
What's new
Group related variables into named sections
Reorder variables within a section
Reorder complete sections
Structure models around business areas, operating drivers, or calculation stages
For example, a revenue model can keep pricing, customer volume, retention, and expansion assumptions in separate sections—without splitting them into different models.
v0.1.0
Jul 1, 2026
The core Oculon app: build models, dashboards & databases
The one that started it all. 0.1.0 is the foundation of Oculon, an AI-native finance workspace where you model, analyze, and report in one place. Build driver-based models, connect your data, and turn it into dashboards your whole team can read.
Modeling & Planning
Build models on a structured system of variables and dimensions, then write formulas with overrides and clean actuals vs. plan separation. Link dimensions across models with time/dimension aggregation, and organize models with ranges, sections, and a last-actual date.
Dashboards & Reporting
Turn models into readable dashboards using cards, charts, and rich text. Configure bar/line charts with flexible display, axes, and selectors.
Database
Create databases from scratch or directly from a query, map dimensions into them, and manage data through list + detail views.
Integrations
Connect external data sources, explore them in a query editor, and manage everything from a dedicated integrations page.
Collaboration & Governance
A shared workspace with sidebar/onboarding/auth, plus sharing for models/boards/databases with user management and teamspaces.
v0.3.6
Oct 16, 2026
Linked and helper variables
Create a variable once. Use it everywhere — it stays one thing.
Until now, reusing a business assumption across models meant recreating it. Headcount in the workforce plan, the opex model, and the P&L; an ARR target in the revenue model and the board plan. Every copy drifts, and updating an assumption means hunting down every duplicate.
You can return to an earlier checkpoint without deleting the history that came after it.
What’s new
- Add existing variables from the Add Variable flow as live references — no separate editable/read-only choice
- Keep values, formulas, dimensions, formatting, and scenarios in sync; edits apply everywhere
- Aggregate or spread values across time granularities, with explicit dimension and scenario mapping
- See the source, access state, granularity, and warnings for changes affecting other pages
- View every placement, dependency, and downstream use in variable details
Changelog
Product updates. Improvements. Fixes.
v0.3.4
Oct 14, 2026
Dashboard page level filters
Change the reporting period or business slice without reconfiguring each card separately.
Oculon is adding page-level time and dimension filters so you can review a dashboard in one consistent context. Select a period, region, department, or another supported dimension from the filter bar at the top of the page.
v0.3.5
Oct 17, 2026
View and clear what AI chat remembers
Persistent memory can make AI more useful across conversations, but users need control over what continues to influence future responses. Oculon now provides visibility into stored memory and clear actions for removing it.
Chat history and persistent memory remain separate: clearing memory does not delete the conversation transcript.
What’s new
See how many workspace memory items are stored
Clear memory created from a specific chat
Let administrators clear all workspace memory
Confirm sensitive workspace-wide clearing before it runs
Continue using chat history without treating cleared information as persistent memory
v0.3.5
Oct 15, 2026
Find everything in the Library
Find models, databases, boards, dimensions, and integrations from one Library. The Library brings the key parts of your workspace together, so you can browse by type, search, filter, and choose the view that suits the way you work.
Find your way around
Browse All files or go straight to Models, Databases, Boards, Dimensions, or Integrations
Search across items, filter by teamspace, and sort to bring relevant work forward
Switch between list view for scanning details and grid view for visual browsing
Get to Recent, Favorites, and Shared with me from All files
Create an item from the current tab with actions tailored to that object type
Keep your tab, search, sort, teamspace, and view reflected in the URL, so your place is easy to revisit or share
v0.3.3
Oct 5, 2026
A redesigned formula editor
Formulas sit at the center of a financial model, but editing them can become difficult as expressions grow and include several references. The formula editor has been redesigned to make the writing experience clearer and more predictable.
The new editor provides more room to work and a cleaner visual structure for building and revising model logic.
v0.3.2
Oct 2, 2026
Auto-sync scenarios from the main plan
Keep scenarios aligned with Main without overwriting local changes
Scenarios are often created before Main Scenario is fully settled. Without inheritance, they become stale as the baseline changes; with indiscriminate syncing, local scenario assumptions could be lost.
Auto-sync from Main keeps eligible inherited values current while ensuring local overrides continue to win.
v0.3.1
Oct 1, 2026
Update the last actual date across every linked model
At every close, finance teams move the boundary between actual results and forecast periods. When several models share the same planning timeline, updating that boundary one model at a time creates repetitive work and the risk of inconsistent reporting.
Oculon will provide an option to change the last-actual date across linked models together.
v0.2.15
Sep 25, 2026
Link dimensions across multiple data sources
The same business dimension often exists in several systems. Departments may appear in both accounting and HR data; regions may exist in CRM and billing; products may be represented differently across operational tools.
A dimension can now be linked to multiple data sources, giving models and databases one consistent structure across connected systems.
v0.2.14
Sep 24, 2026
Govern, merge, and delete scenarios
Scenario planning should support experimentation without leaving teams with disconnected copies or unclear authority. Once a scenario has been reviewed, teams need a controlled way to move its changes into another scenario or the main plan.
Oculon now supports explicit scenario merging together with governance, access, locking, and deletion controls.
What’s new
Merge scenario-specific overrides into another scenario
Use Main Scenario as the primary destination for reviewed changes
Confirm the source and destination before a merge runs
Merge only local overrides rather than copying the entire scenario state
Apply scenario access and governance controls
Lock approved scenarios against unwanted changes
Let administrators permanently delete obsolete non-main scenarios
Keep Main Scenario protected from deletion planning scenarios side by side
v0.2.13
Sep 22, 2026
Analyze scenarios side by side without rebuilding comparison logic.
A financial result has more meaning when viewed alongside alternative plans. Finance teams need to understand how one scenario differs from another and how those differences affect key outcomes.
Oculon now brings scenario comparison directly into models, charts, and dashboard cards.
What’s new
Compare planning scenarios side by side
Compare values against another scenario or planning case
Surface variances between scenarios
Add scenario comparison context to charts and dashboard cards
Scenario comparison controls are available directly on dashboard cards
v0.2.12
Aug 17, 2026
Access your AI chat history from the sidebar
Return to previous planning and analysis conversations with their context intact.
AI work rarely ends in one message. A useful conversation may contain assumptions, analysis, decisions, and follow-up questions that need to be revisited later.
Your Oculon AI chat history is now accessible from the application sidebar, making previous conversations easier to find and continue.
What’s new
Open AI chat history from a dedicated sidebar tab
Browse previous conversations without leaving your current workspace
Return to an earlier thread in one click
Continue working with the context already captured in that conversation
v0.2.11
Aug 15, 2026
Link queries to databases and track their status
Keep data lineage and freshness visible where the data is used.
A database is only dependable when you know where its data came from and whether it is current. You can now link an integration query directly from a database view and see the state of that connection in context.
This creates a clearer path from connected source data to the databases used for financial analysis.
What’s new
Link an existing query directly from a user database view
Use query results as the connected source for the database
See the linked query associated with an integration database
Check the current sync state without leaving the database
v0.2.10
Aug 14, 2026
Add live model, database, and dimension tables to dashboards
Keep headline charts and supporting detail together on the same review page.
Dashboards often need to do two jobs: communicate the headline and provide enough detail for someone to understand it. Charts and summary cards show the story, but finance reviews frequently move back to the underlying model or database to inspect the numbers.
You can now place live model, database, and dimension tables directly inside an Oculon dashboard.
What’s new
Insert a model table into a dashboard
Insert a database table into a dashboard
Add a dimension table for detailed breakdowns
Combine live tables with charts, cards, and explanatory content
Keep model and database outputs connected to their source
v0.2.9
Aug 13, 2026
Add columns, formulas, filters, and time-series views to databases
Oculon databases now go beyond storing rows. Add structured columns, organize large datasets, calculate new metrics, and analyze how values change over time—all from the database view.
Finance teams can shape incoming data for the question at hand without rebuilding the source or moving the analysis into another tool.
What’s new
Add variable, dimension, and text columns to a database
Set columns as time, variable, or dimension fields
Sort rows by the values that matter
Filter a database to the relevant period, entity, category, or condition
Group records around a shared business dimension
Create calculated variables with formulas inside a database
View database values as a time series
Choose how time-based variables aggregate across periods
v0.2.8
Aug 12, 2026
Find any model, dashboard, or database with ⌘K
Jump directly to the right file without navigating through folders and teamspaces.
As an Oculon workspace grows, remembering where every model, dashboard, and database lives becomes unnecessary overhead. Global search provides one keyboard-first entry point from anywhere in the application.
Press ⌘ K on Mac or Ctrl K on Windows, type part of a file name, and open the right result without leaving your current flow.
What’s new
Open global search from anywhere with
⌘ KorCtrl KSearch models, dashboards, and databases by name
Find results with plain-text or fuzzy matching
See file type and location for similarly named results
Move through results with the arrow keys
Press Enter to open a result and Escape to close search
Respect existing workspace permissions in search results
v0.2.7
Aug 3, 2026
Control which scenarios can be merged
Let teams explore alternatives without giving every scenario authority to change the shared plan.
A scenario can be useful for exploration without being ready to influence the main plan. Teams need a clear boundary between the freedom to model an alternative and the authority to merge it into a shared baseline.
What’s new
Enable or disable Allow Merging for each scenario
Prevent a scenario from initiating a merge when the control is off
Keep editing rights separate from merge rights
Make unavailable merge actions clear in the interface
Apply merge eligibility consistently across product and automated workflows
v0.2.6
Jul 31, 2026
Color-code variable rows to scan models faster
Use color to distinguish assumptions, calculations, subtotals, and key outputs.
Large financial models contain different kinds of information: assumptions, calculations, subtotals, and final outputs. When every row looks the same, reviewers have to inspect each label or formula before understanding how the model is organized.
Variable row colors let you create a visual language for the model and draw attention to the lines that matter.
What’s new
Apply a color to any variable row
Visually distinguish assumptions from calculated values
Highlight subtotals, outputs, and key drivers
Use consistent row styling across a model
v0.2.5
Aug 1, 2026
Switch Oculon to dark mode
Use a consistent dark theme across models, dashboards, databases, and AI chat.
Oculon now includes a complete dark theme across the application. Switch between light and dark mode based on your environment or preference. Once selected, Oculon remembers the setting across sessions.
v0.2.3
Aug 6, 2026
See how revenue, expenses, headcount, and other metrics change without adding extra formulas.
Understanding a number often requires more than seeing its current value. You need to know how it compares with the previous month, quarter, or year.
Time comparisons let you compare values with an earlier period directly inside a model, without creating additional formulas or manually maintaining comparison rows.
What’s new
Compare a value against an earlier time period
Surface period-over-period movement within the model
Reuse the same comparison logic across changing dates
Reduce the number of supporting formulas needed for variance analysis
v0.2.2
Jul 23, 2026
Create dimension-based variables without duplicating rows
Many financial metrics need to be planned across a business dimension: revenue by product, headcount by department, expenses by entity, or customers by region.
Dimension-based variables let you create one variable and automatically expand it across the members of a selected dimension. You get the detail needed for planning and analysis without manually creating and maintaining a separate row for every combination.
What’s new
Create a variable driven by a dimension
Break a metric out across every member of that dimension
Add dimension members without manually rebuilding the model structure
Keep detailed models compact and easier to maintain
v0.2.4
Jul 27, 2026
Reference models, dashboards, and databases with @mentions
AI responses are more reliable when the relevant context is explicit. Use @ mentions in AI chat to reference specific Oculon files and spaces.
Instead of asking AI to infer which model or dashboard you mean, point it directly to the source it should read.
What’s new
Mention a model in AI chat
Reference a dashboard
Reference a database
Reference an Oculon space
Ground responses in the selected workspace context
v0.2.1
Jul 25, 2026
Attach images, CSVs, Excel and PDFs in AI chat
Financial work often begins with a spreadsheet, report, screenshot, or PDF. Instead of manually transferring that information or describing it in a prompt, attach the source material directly to Oculon AI chat.
Oculon can read the attachment, use its contents as context, answer questions about it, and help turn the underlying information into structured analysis or models.
What’s new
Attach images to an AI conversation
Upload and analyze CSV files
Work with Excel spreadsheets
Read and analyze PDFs
Use attached files as context for answers and model-building
v0.1.4
Jul 21, 2026
Create separate workspaces for entities, teams, and clients
You can now create and manage multiple Oculon workspaces, keeping each environment cleanly separated while making it easy to move between them.
What’s new
Create multiple workspaces
Switch between workspaces
Manage each workspace independently
Keep data, models, dashboards, and members separated by workspace
This gives organizations room to grow without forcing unrelated planning work into one shared environment.
v0.1.3
Jul 21, 2026
Manage teamspaces, roles, and permissions with confidence
Not every model, dashboard, or database should be visible to everyone. Oculon now gives administrators a structured way to organize people into teamspaces and manage access through roles and permissions.
Create teamspaces for groups such as Finance, Revenue, People, or individual business units. Each teamspace provides a dedicated area for the models, dashboards, databases, and documents relevant to that team.
What's new
Central administration for teamspaces
User roles and permissions
Teamspace settings
Space-level access controls
v0.1.2
Jul 17, 2026
Format variables and filter dashboard cards for clearer reporting
Present numbers consistently and focus each card on the period, dimension, and scenario that matters.
Financial information is easier to understand when numbers are presented consistently and reporting views show only what matters. This release adds variable formatting and more control over the information displayed in dashboard cards.
Format variables for their financial meaning
Control how variables appear so percentages, currencies, counts, and other metrics are immediately recognizable. Reviewers can interpret values correctly without relying on row names or additional explanations.
Focus dashboard cards on the right context
Filter dashboard cards by date, dimension, and scenario. A single dashboard can show the appropriate period, entity, department, product, or planning scenario without duplicating the underlying analysis.
What’s new
Apply number and display formatting to variables
Filter dashboard cards by date
Filter cards by dimension
Filter cards by scenario
v0.1.1
Jul 20, 2026
Organize variables into sections with drag-and-drop
Group and reorder related variables so large models are easier to navigate and review.
As models grow, related assumptions and calculations become harder to find. Variables can now be grouped into named sections and reordered with drag-and-drop, making a model easier to navigate, review, and explain.
What's new
Group related variables into named sections
Reorder variables within a section
Reorder complete sections
Structure models around business areas, operating drivers, or calculation stages
For example, a revenue model can keep pricing, customer volume, retention, and expansion assumptions in separate sections—without splitting them into different models.
v0.1.0
Jul 1, 2026
The core Oculon app: build models, dashboards & databases
The one that started it all. 0.1.0 is the foundation of Oculon, an AI-native finance workspace where you model, analyze, and report in one place. Build driver-based models, connect your data, and turn it into dashboards your whole team can read.
Modeling & Planning
Build models on a structured system of variables and dimensions, then write formulas with overrides and clean actuals vs. plan separation. Link dimensions across models with time/dimension aggregation, and organize models with ranges, sections, and a last-actual date.
Dashboards & Reporting
Turn models into readable dashboards using cards, charts, and rich text. Configure bar/line charts with flexible display, axes, and selectors.
Database
Create databases from scratch or directly from a query, map dimensions into them, and manage data through list + detail views.
Integrations
Connect external data sources, explore them in a query editor, and manage everything from a dedicated integrations page.
Collaboration & Governance
A shared workspace with sidebar/onboarding/auth, plus sharing for models/boards/databases with user management and teamspaces.
v0.3.6
Oct 16, 2026
Linked and helper variables
Create a variable once. Use it everywhere — it stays one thing.
Until now, reusing a business assumption across models meant recreating it. Headcount in the workforce plan, the opex model, and the P&L; an ARR target in the revenue model and the board plan. Every copy drifts, and updating an assumption means hunting down every duplicate.
You can return to an earlier checkpoint without deleting the history that came after it.
What’s new
- Add existing variables from the Add Variable flow as live references — no separate editable/read-only choice
- Keep values, formulas, dimensions, formatting, and scenarios in sync; edits apply everywhere
- Aggregate or spread values across time granularities, with explicit dimension and scenario mapping
- See the source, access state, granularity, and warnings for changes affecting other pages
- View every placement, dependency, and downstream use in variable details