Industries · Oculon for Supply Chain & Logistics
Supply Chain & LogisticsKnow what the service choice costs.
A blended shipment cost can hide the lane that drives it. Compare the network assumptions with service and capacity before choosing an alternative.
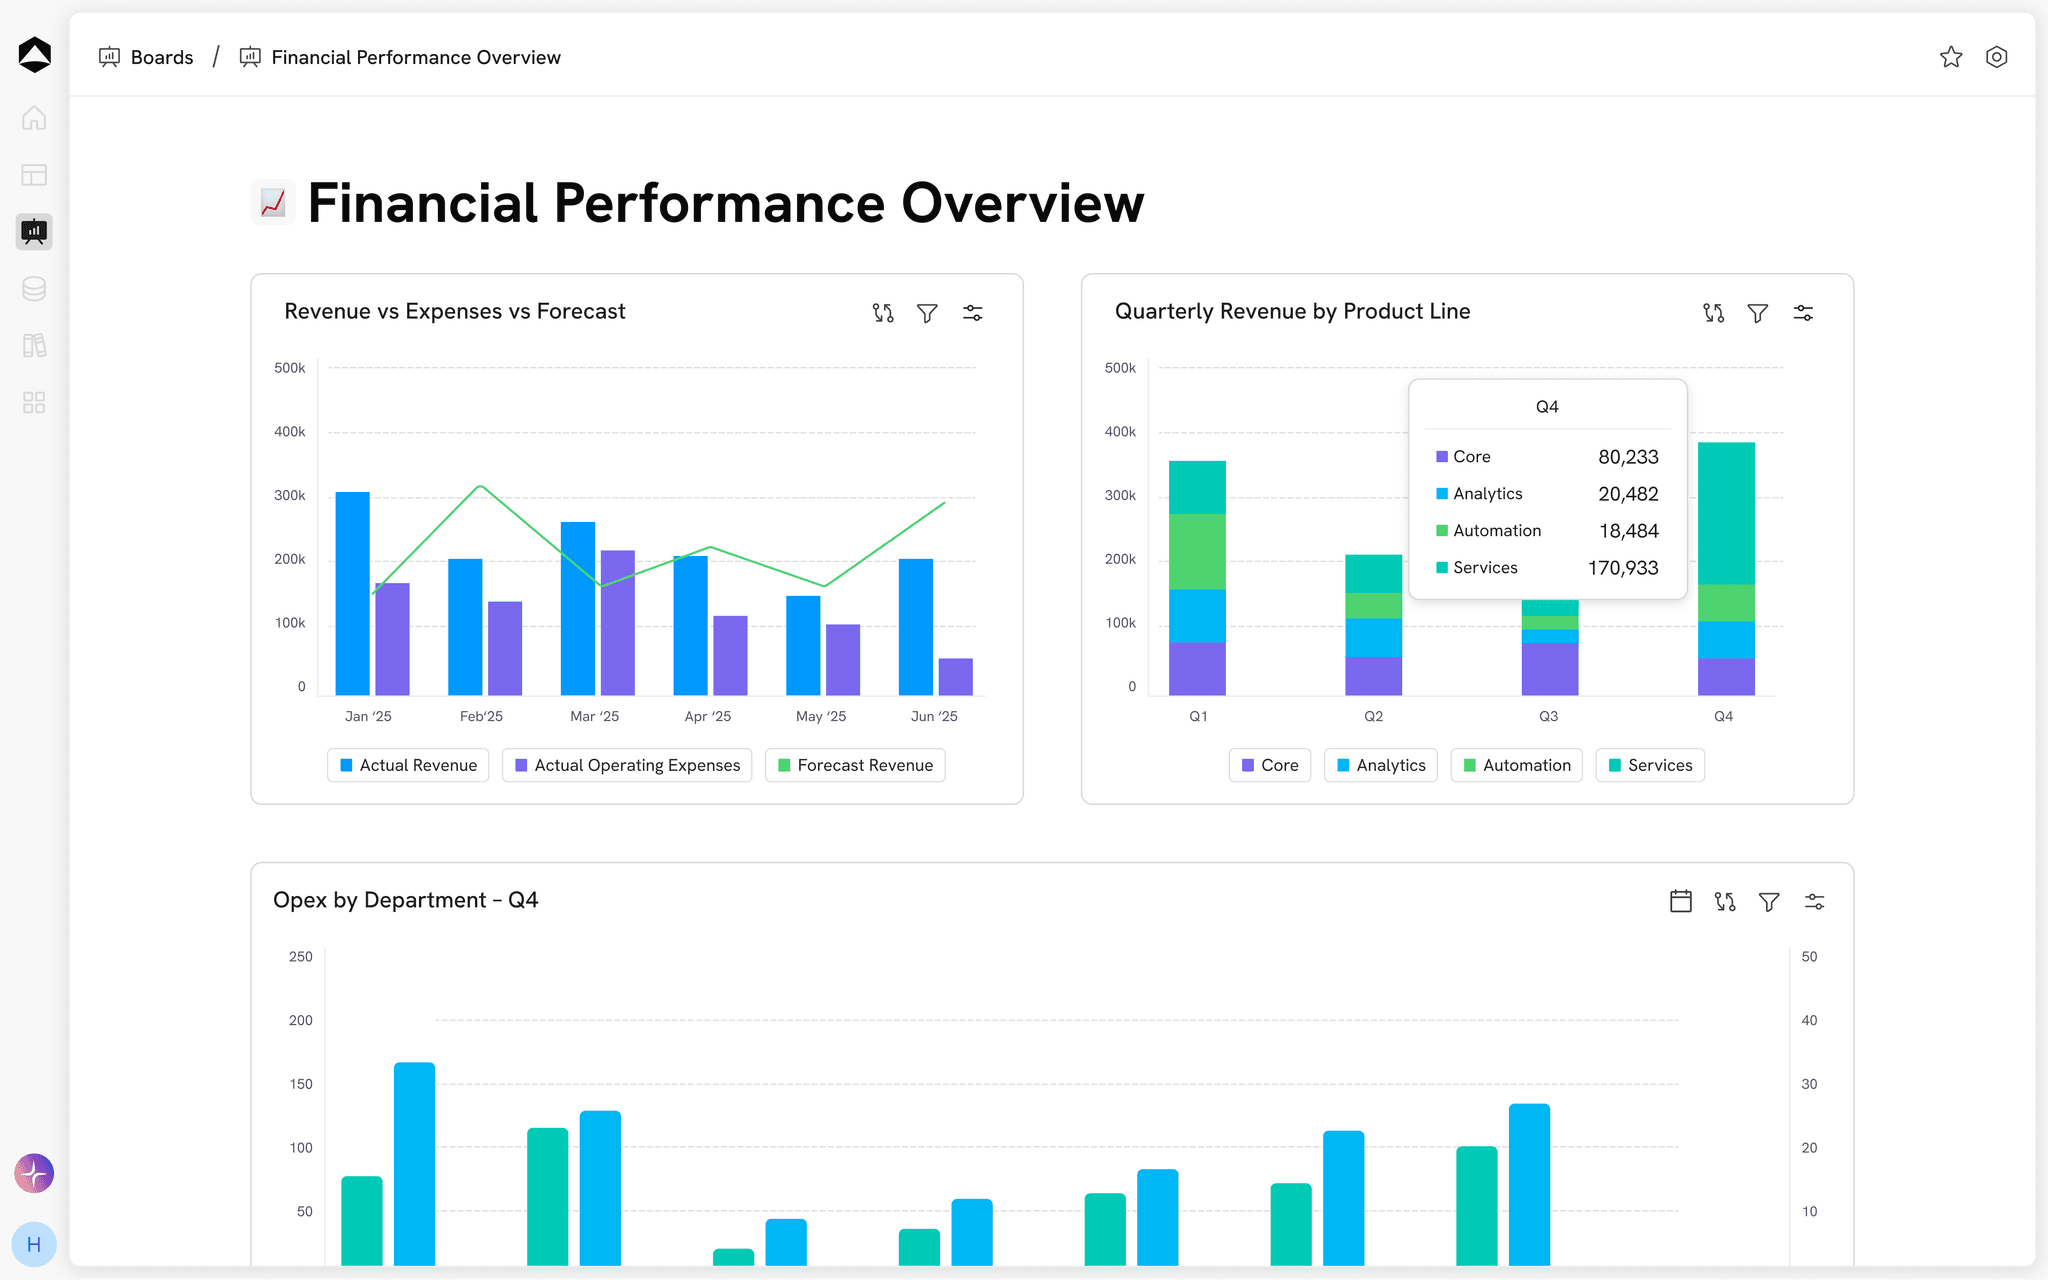
The business behind the numbers
Make service choices a clearer financial decision.
For Logistics finance and network teams.
Keep the lane detail
Show the volumes and unit rates contributing to the blended result.
Compare like-for-like service
Challenge capacity, delivery time, fuel, and contract assumptions before treating a lower rate as equivalent.
Review the commitment
Connect the chosen service plan to payment terms and operating constraints.
From context to the next move
Put the plan to work.
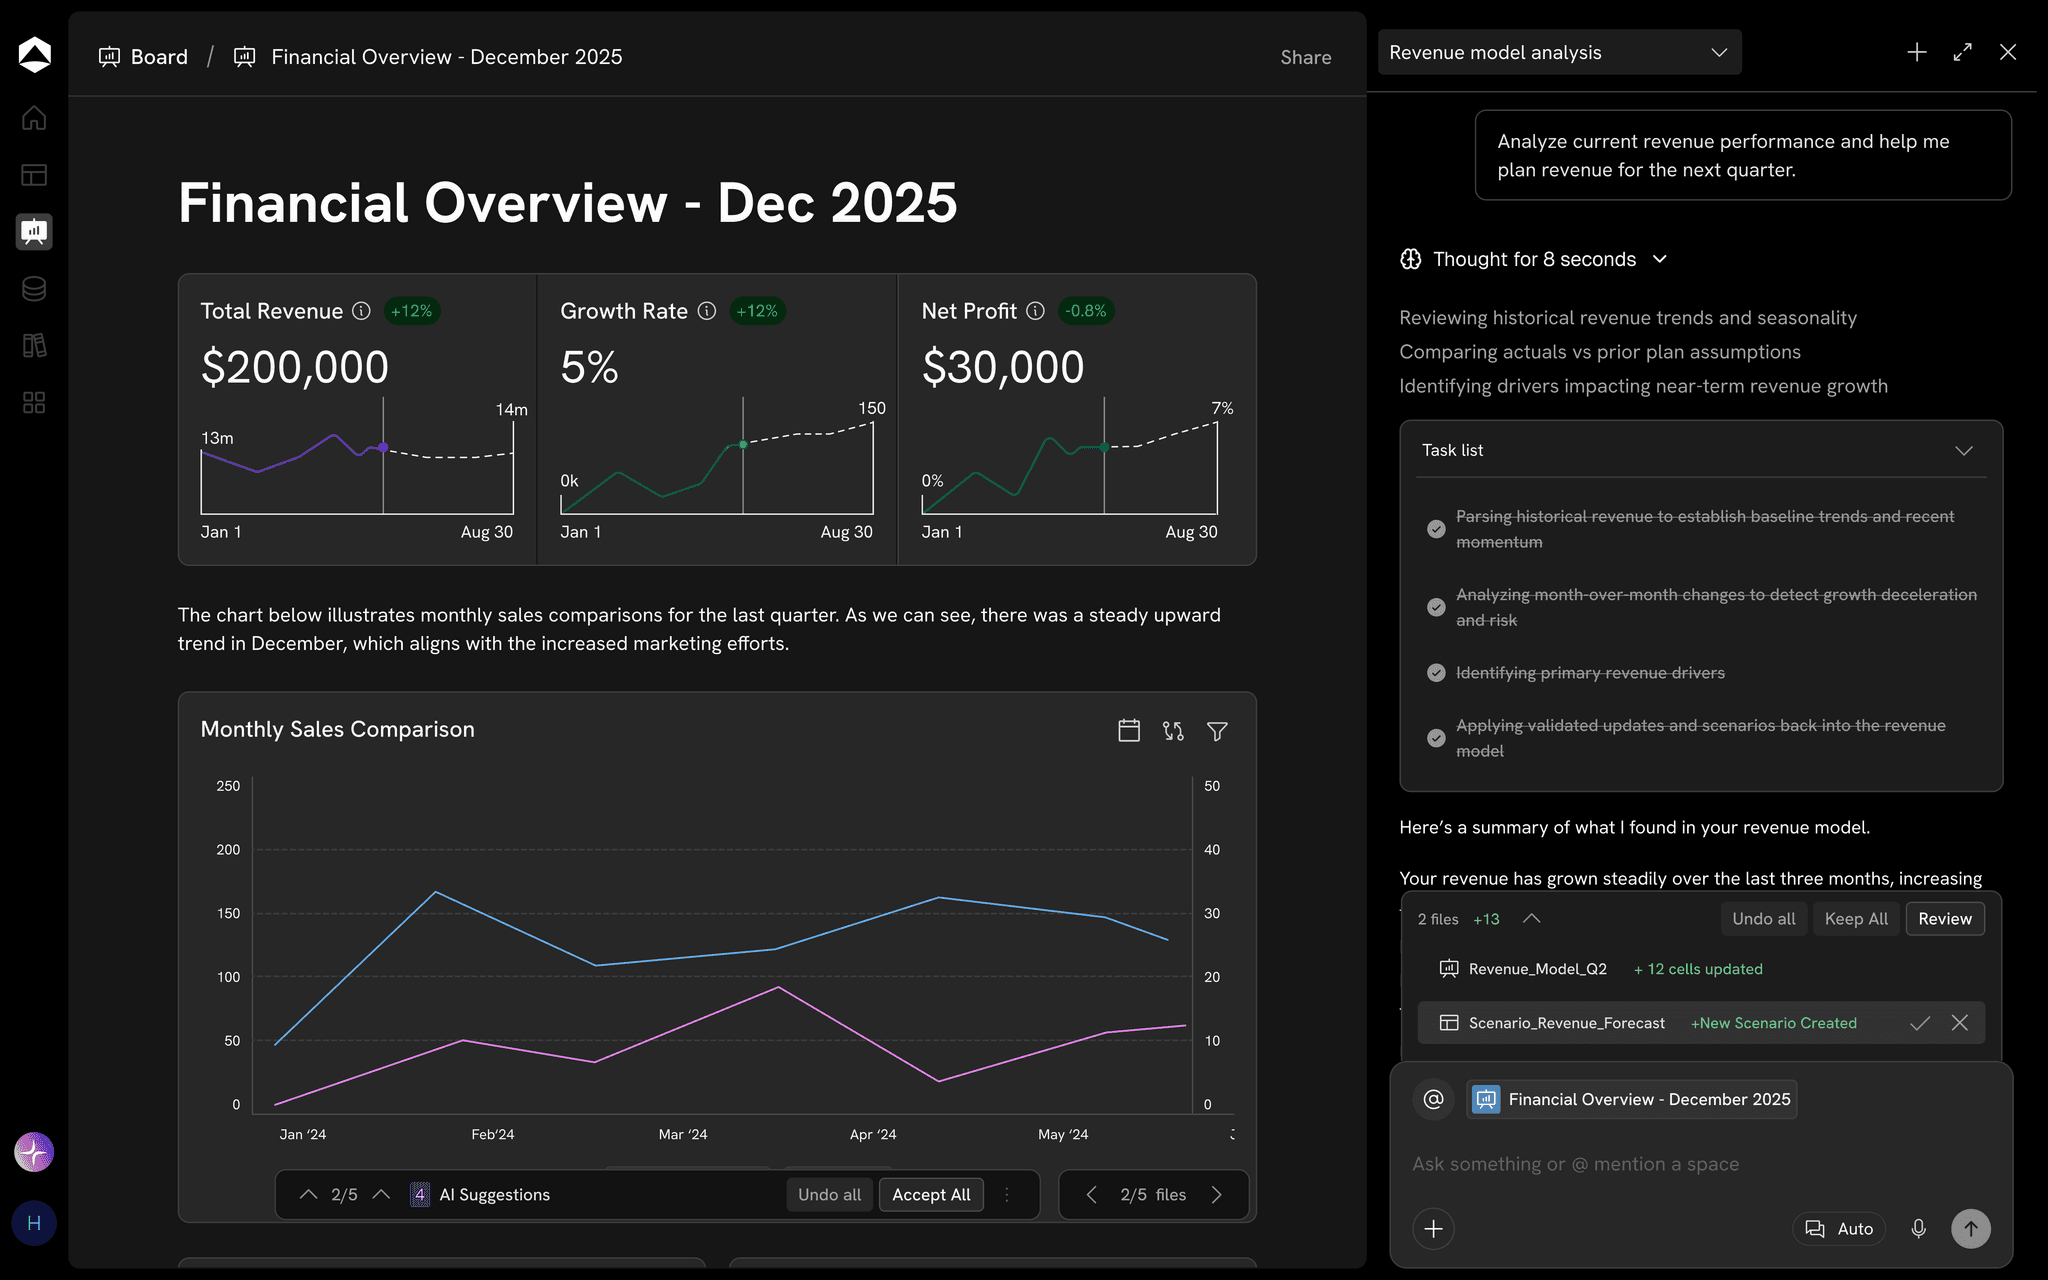
Keep the inputs, model and review connected around the work in front of you.
Connected inputs
Model the lane context
Keep demand, shipment volume, and network dimensions together.
Explore connected data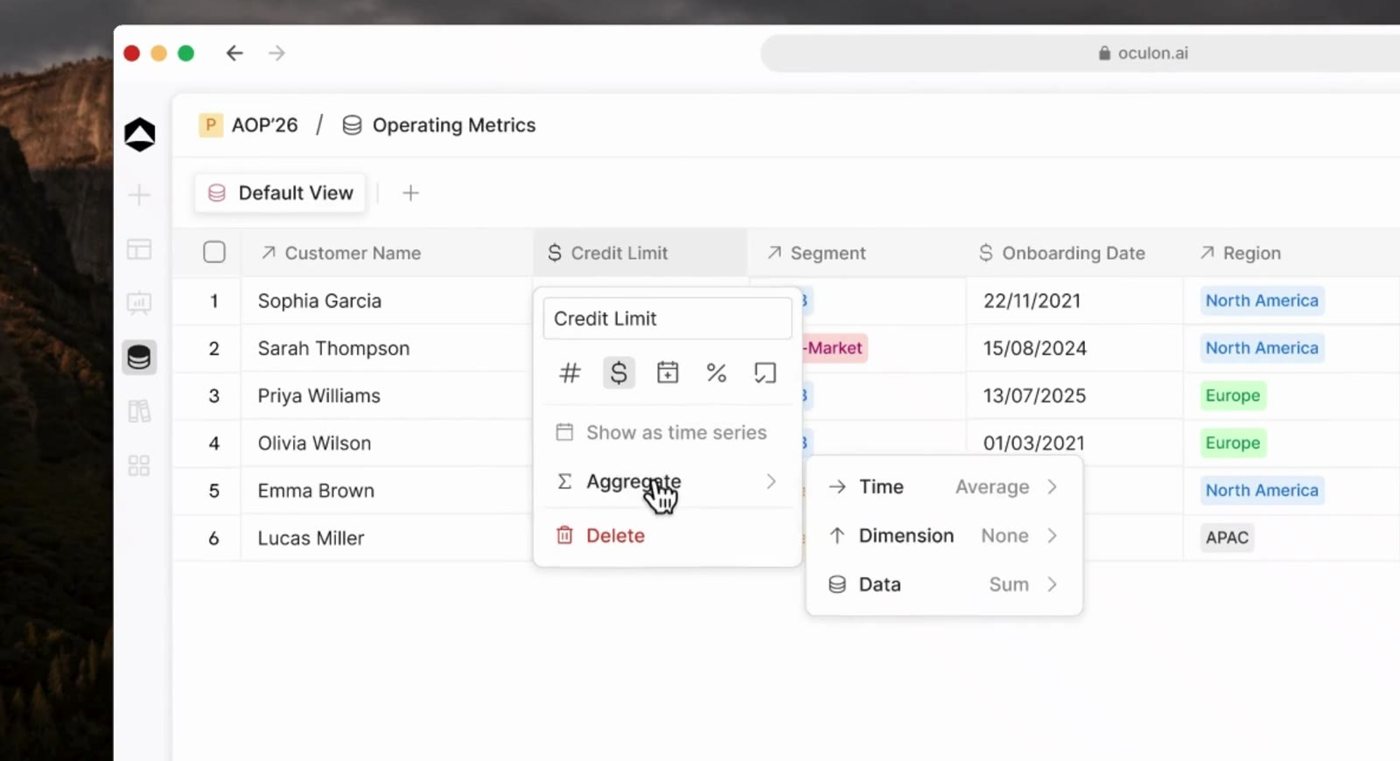
Business drivers
Understand cost to serve
Compare fulfillment and transport costs in the service context.
Explore financial models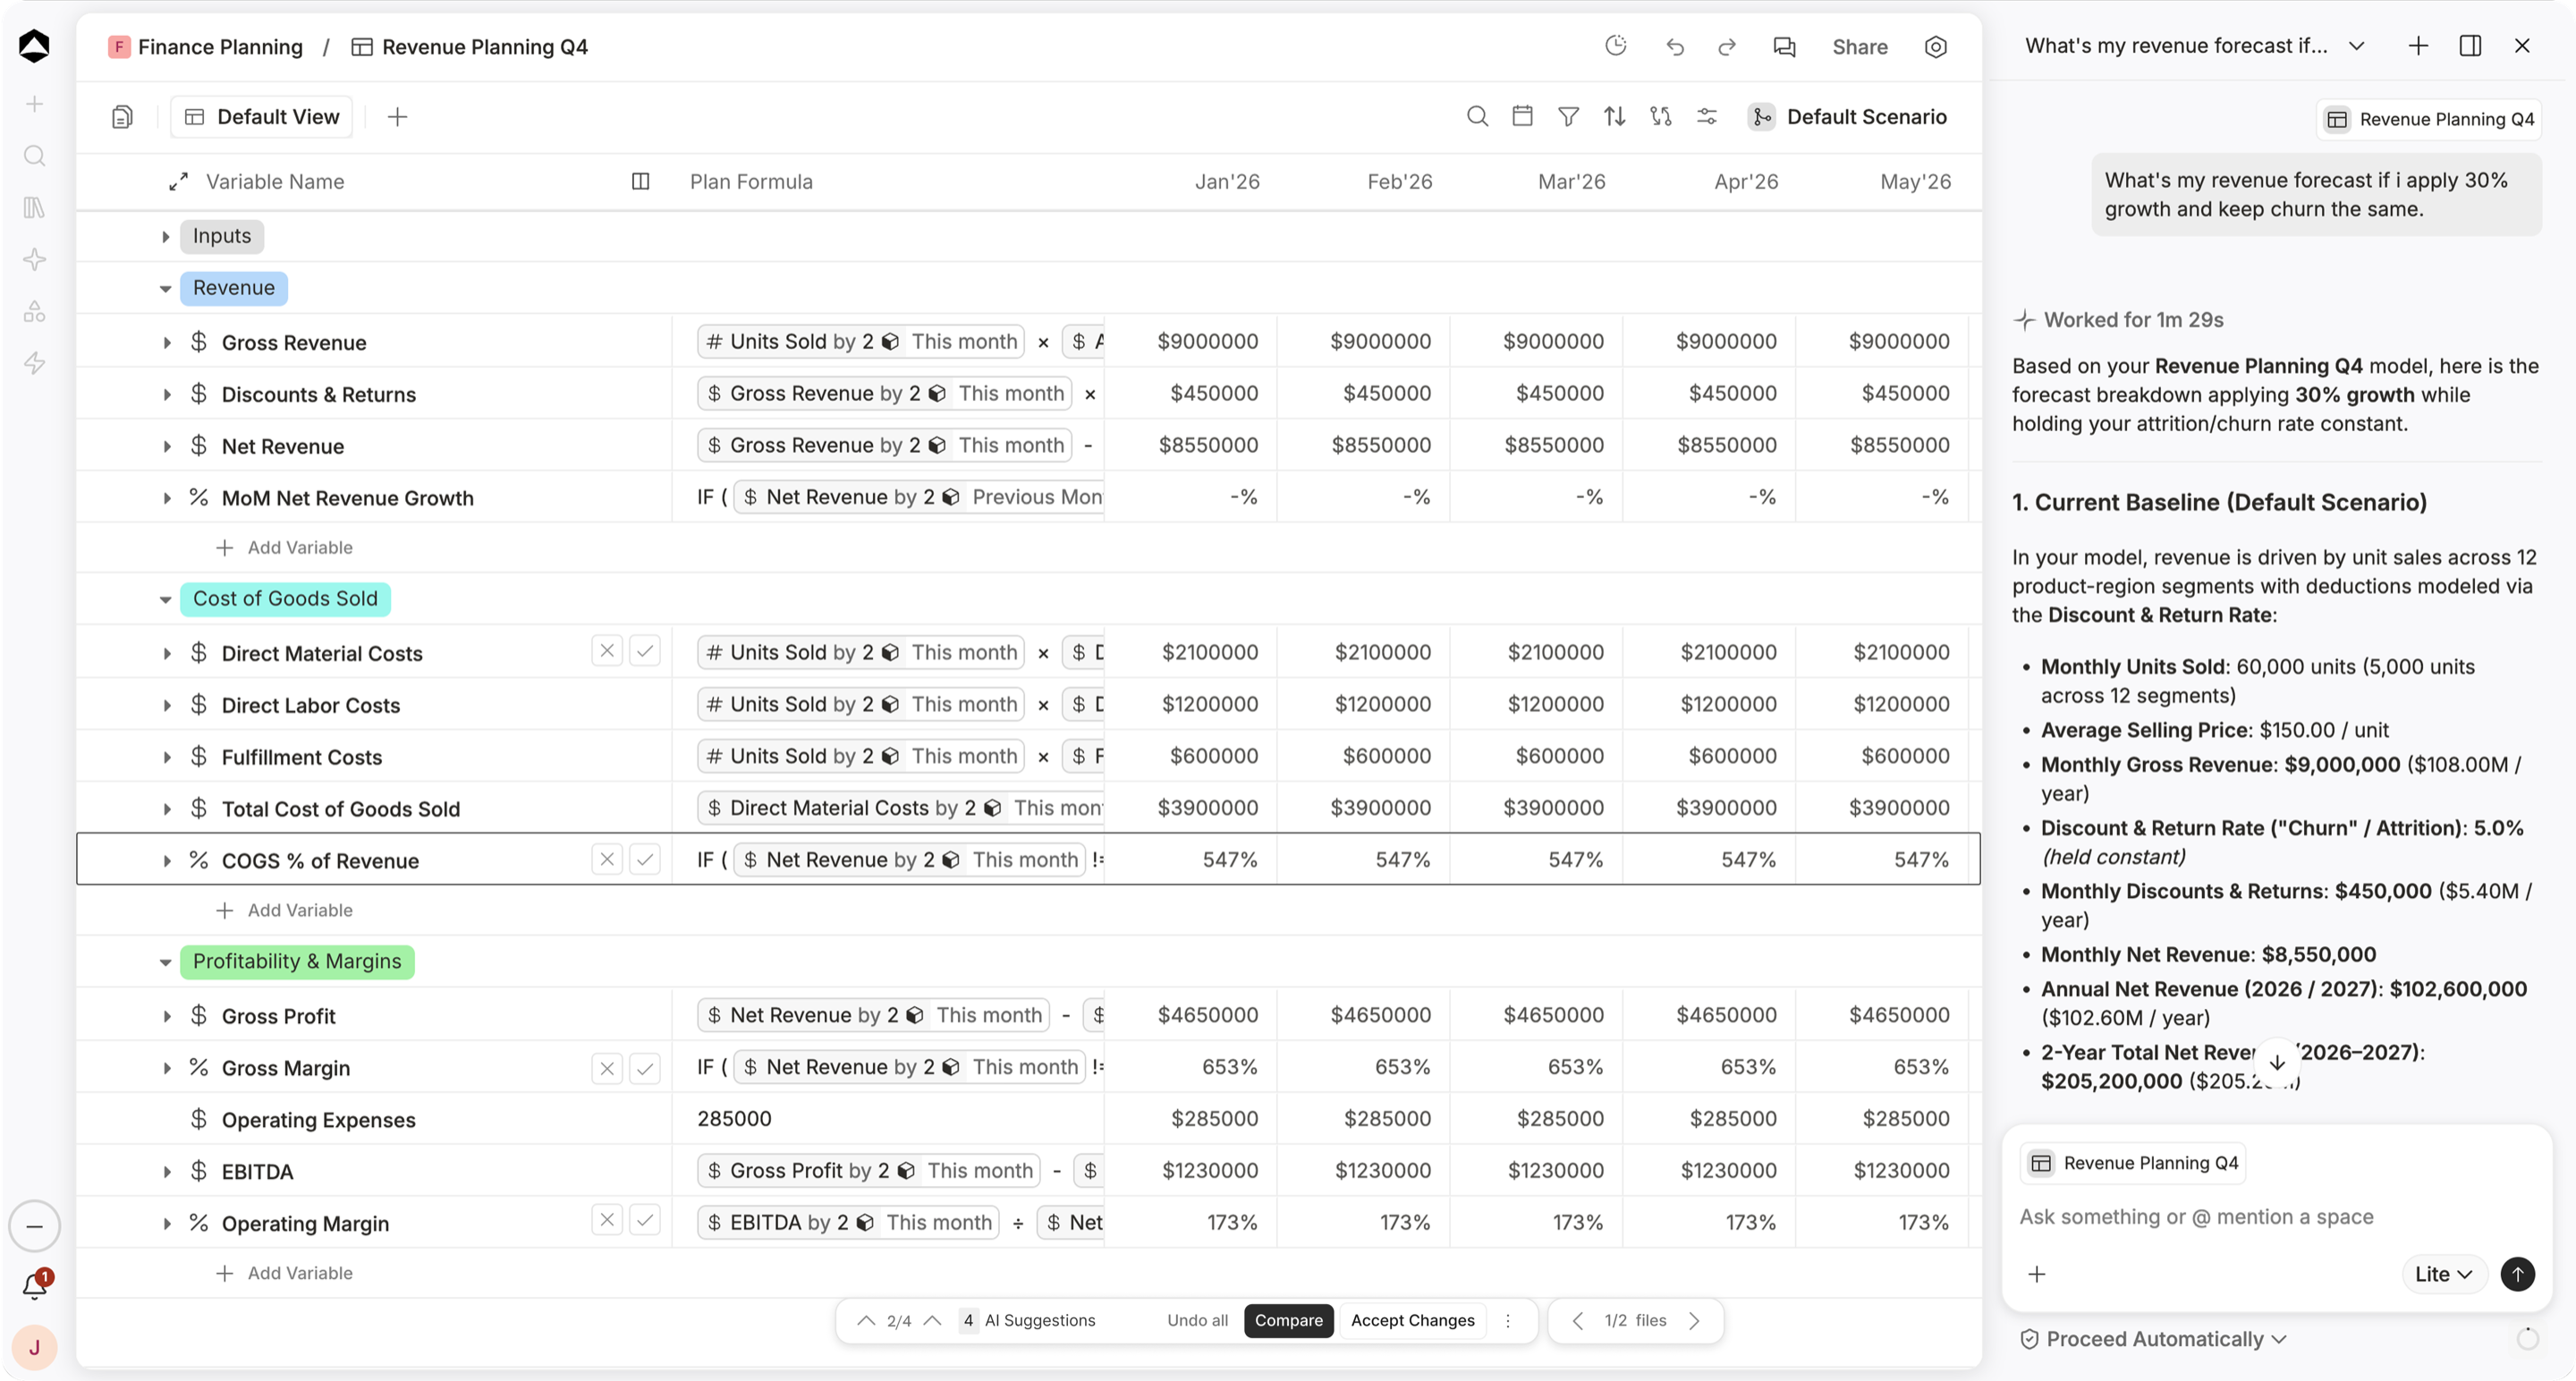
Planning choices
Review the trade-off
Connect a network choice to service, operating cost, and cash.
Explore scenarios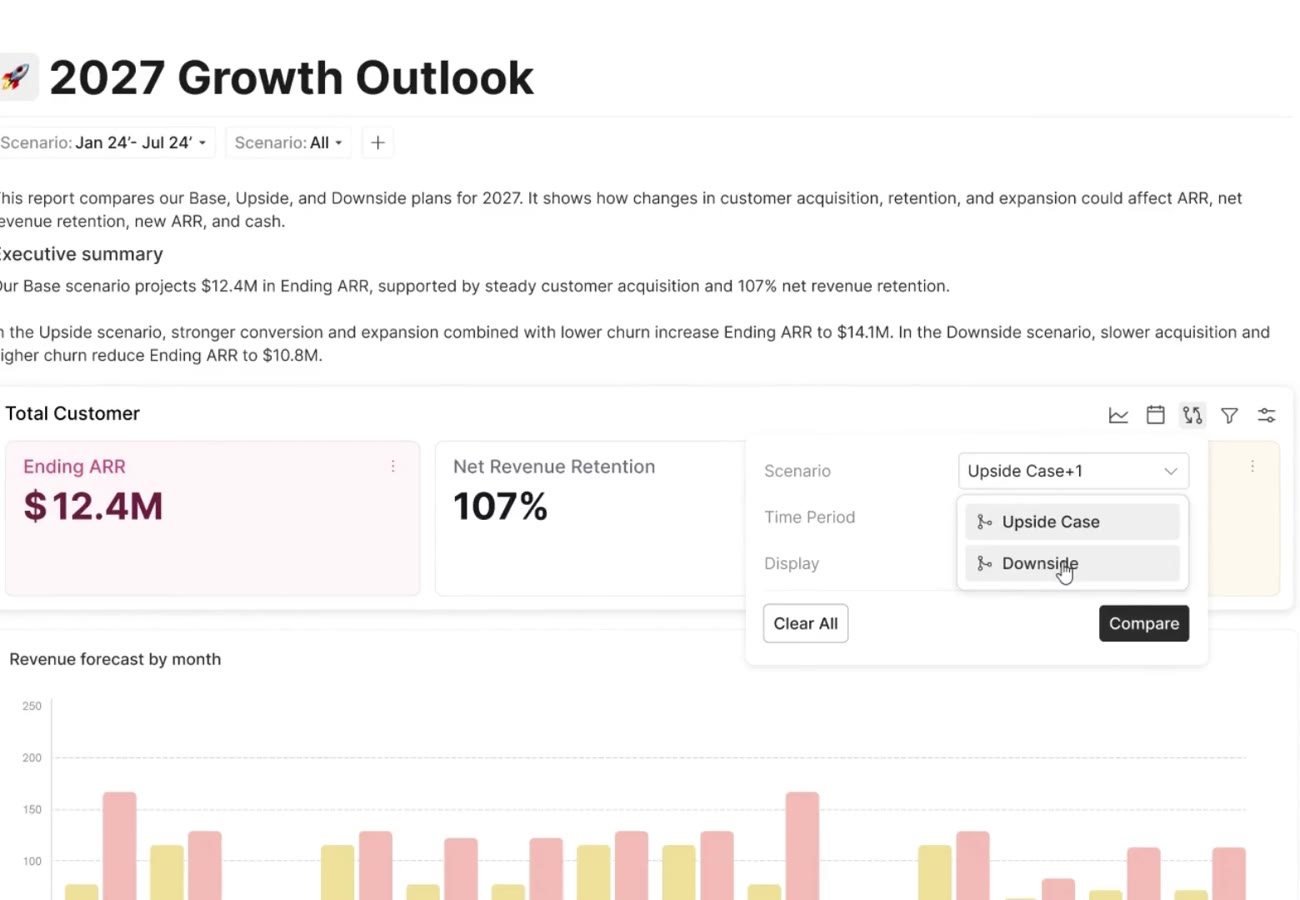
Shared review
Review the commitment
Review delivery times, capacity, and contract commitments on each lane before using the lower blended cost in the plan.
Explore shared boards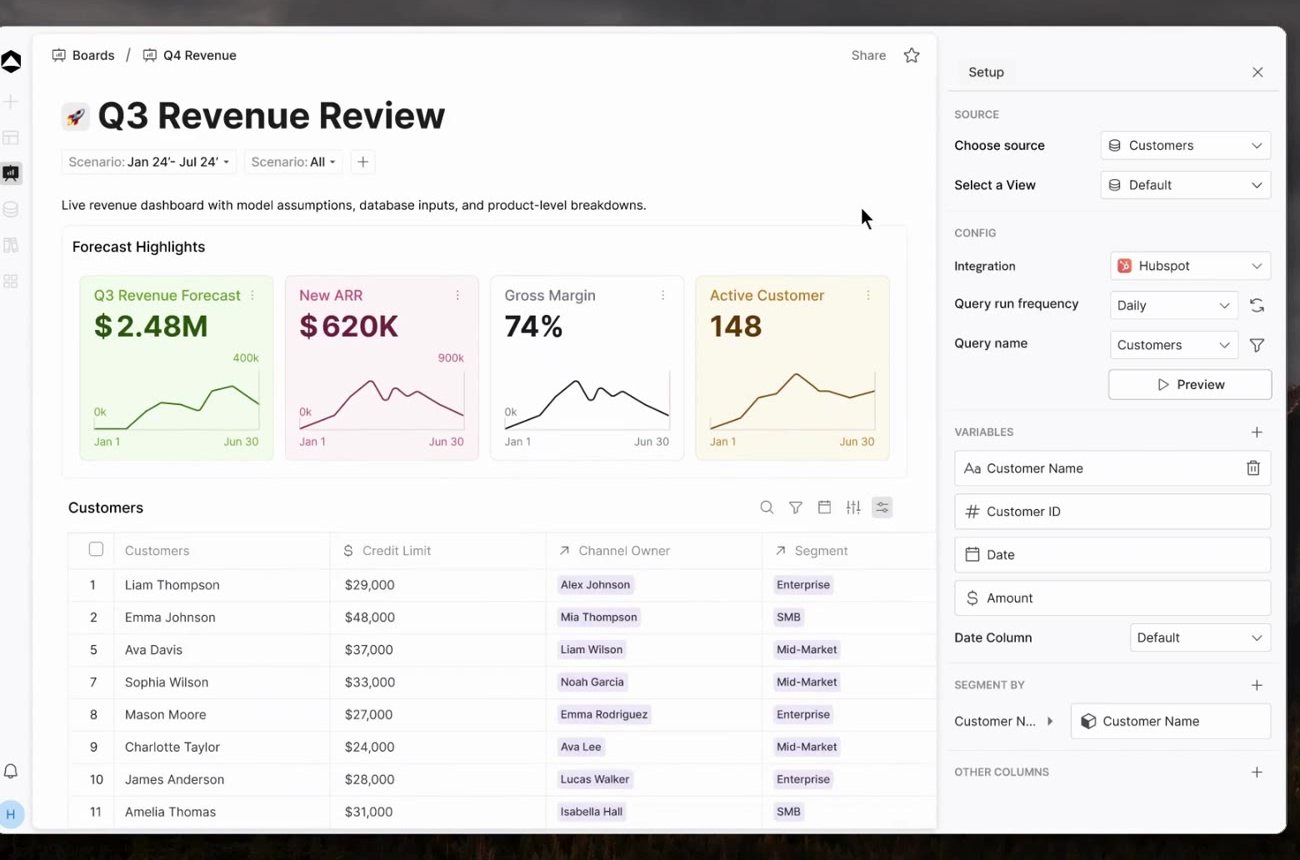
One connected financial picture
Where does the $15K network-cost difference come from?
Review delivery times, capacity, and contract commitments on each lane before using the lower blended cost in the plan.
Explore the network cost-to-serve example
Lane cost = shipments × cost per shipment, with displayed unit costs rounded. Blended cost = total modeled cost ÷ all shipments.
October 2026 · monthly network plan · Illustrative dataTHE ECONOMICS IN VIEW
Where does the $15K network-cost difference come from?
Cost per shipment by lane
USD per shipmentInspect the model inputs3 model lines
| Network lane | Shipments | Cost / shipment | Total cost |
|---|---|---|---|
| 4,000 | $16 | $64K | |
| 3,000 | $20 | $60K | |
| 3,000 | $18.67 | $56K |
Scroll to inspect all columns
Fuel and contract rates sit inside the modeled lane costs. Service levels, capacity, payment timing, and rounding need review; this is not route optimization.
A little more context
Questions about Supply Chain & Logistics.
Does the illustration optimize routes automatically?
It illustrates comparing network assumptions in a financial model. It does not imply a routing engine or automated dispatch feature. Bring your modeling and operational data needs into a walkthrough.
Does the example optimize delivery routes?
No. It compares authored financial assumptions for three lanes. Scheduling, dispatch, route optimization, and execution records are separate operational requirements.
What should we agree before comparing plans?
Lane cost = shipments × cost per shipment, with displayed unit costs rounded. Blended cost = total modeled cost ÷ all shipments.
Where can we find a starting model?
Explore templates for planning, revenue, cash, headcount and reporting. Adapt the assumptions and structure to your business, and agree access with the people who will review the work.
Explore templates