Industries · Oculon for Fintech
FintechSee what payment growth actually earns.
For payments businesses, volume is only the beginning. Compare customer pricing and processing fees before treating transaction growth as financial upside.
The business behind the numbers
Bring volume, yield, and cost into the same review.
For Payments fintech finance teams.
Define the transaction scope
Keep payment volume and the period behind the fee denominator clear.
Separate the fees
Show customer pricing and processing charges independently before comparing net take rates.
Review the full economics
Add losses, delivery scope, and settlement timing to the decision.
From context to the next move
Put the plan to work.
Keep the inputs, model and review connected around the work in front of you.
Connected inputs
Keep the volume context
Model products, markets, and customer segments with shared definitions.
Explore connected data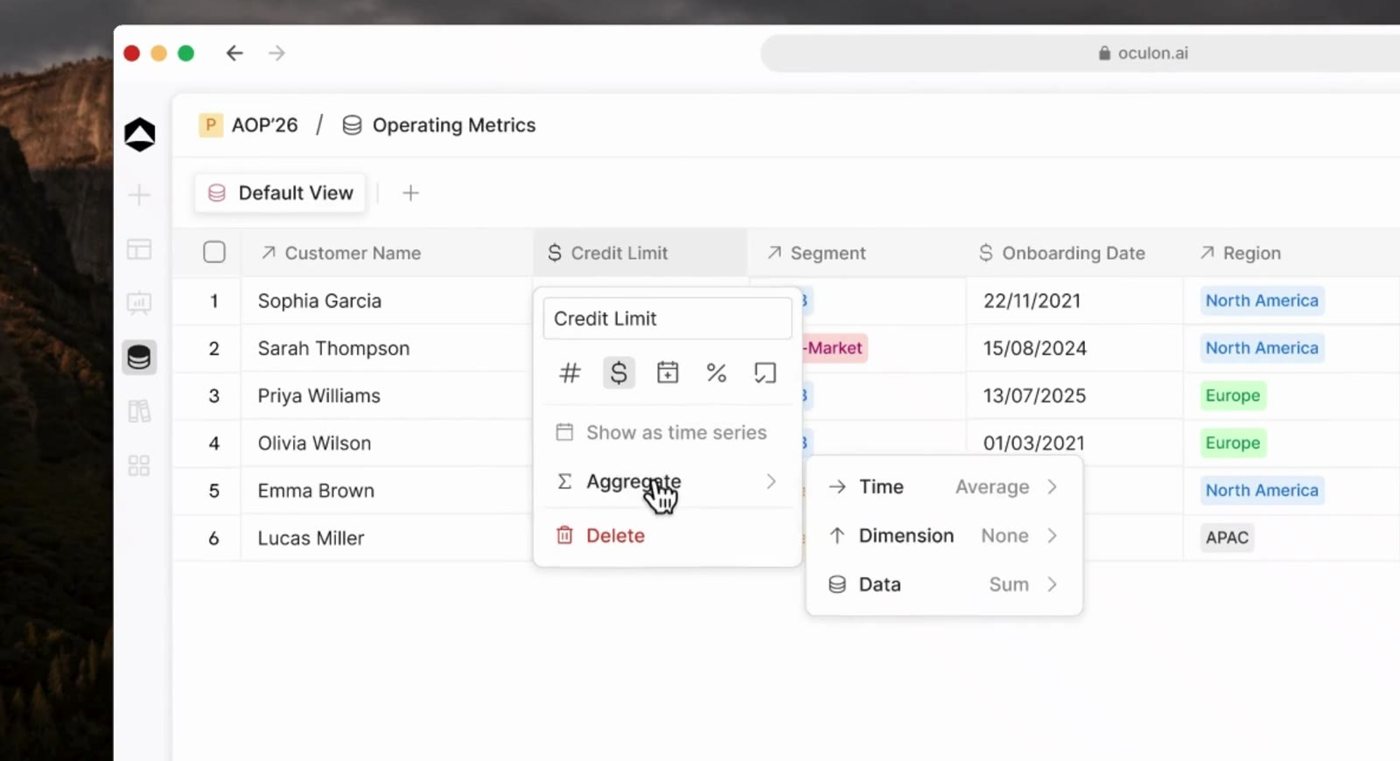
Business drivers
Separate the economics
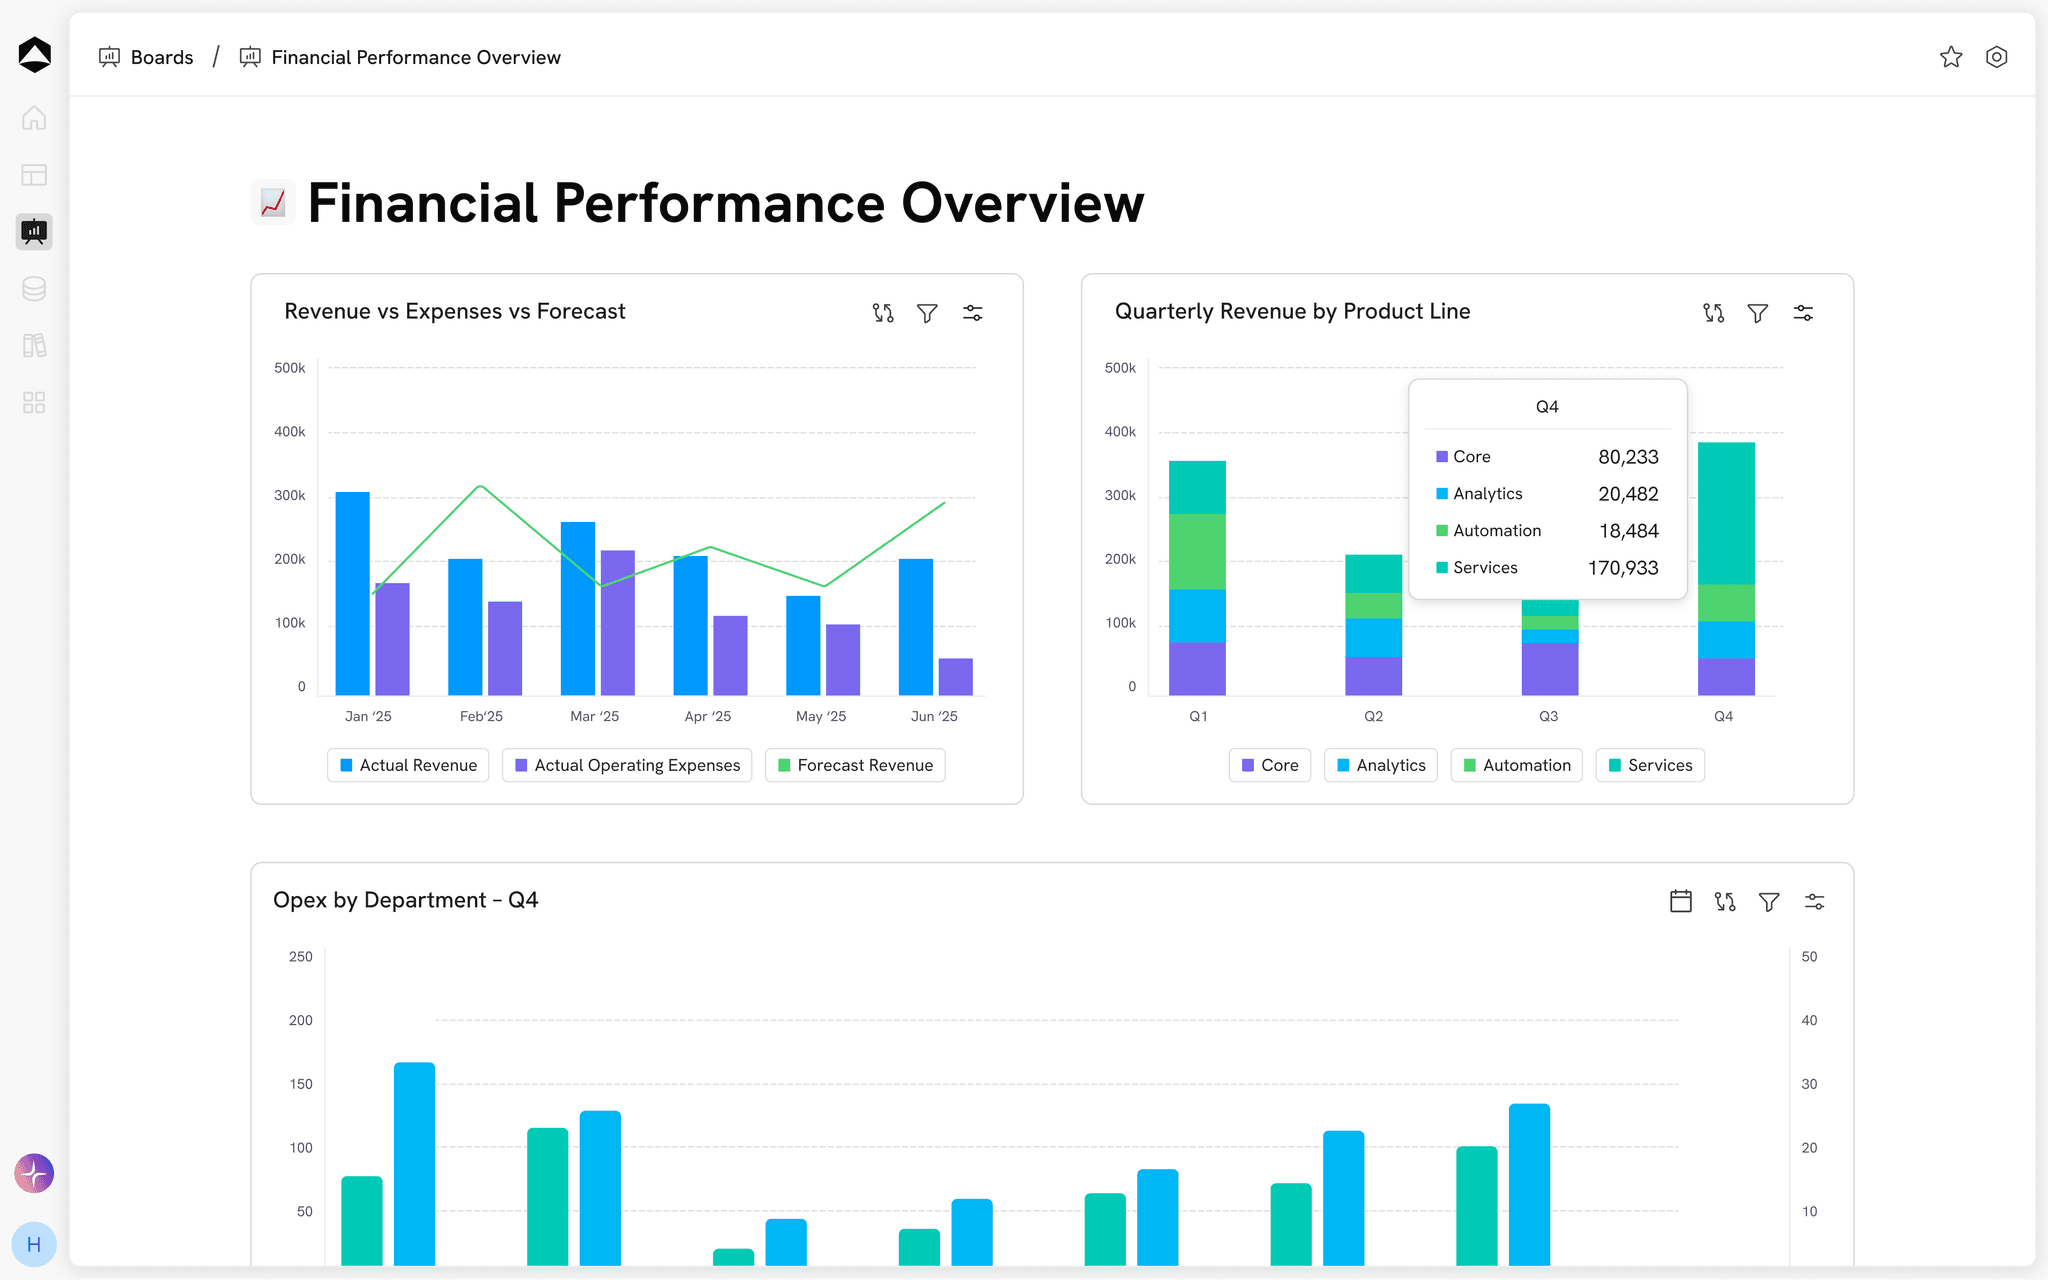
Review customer yield and processing costs before the operating result.
Explore financial models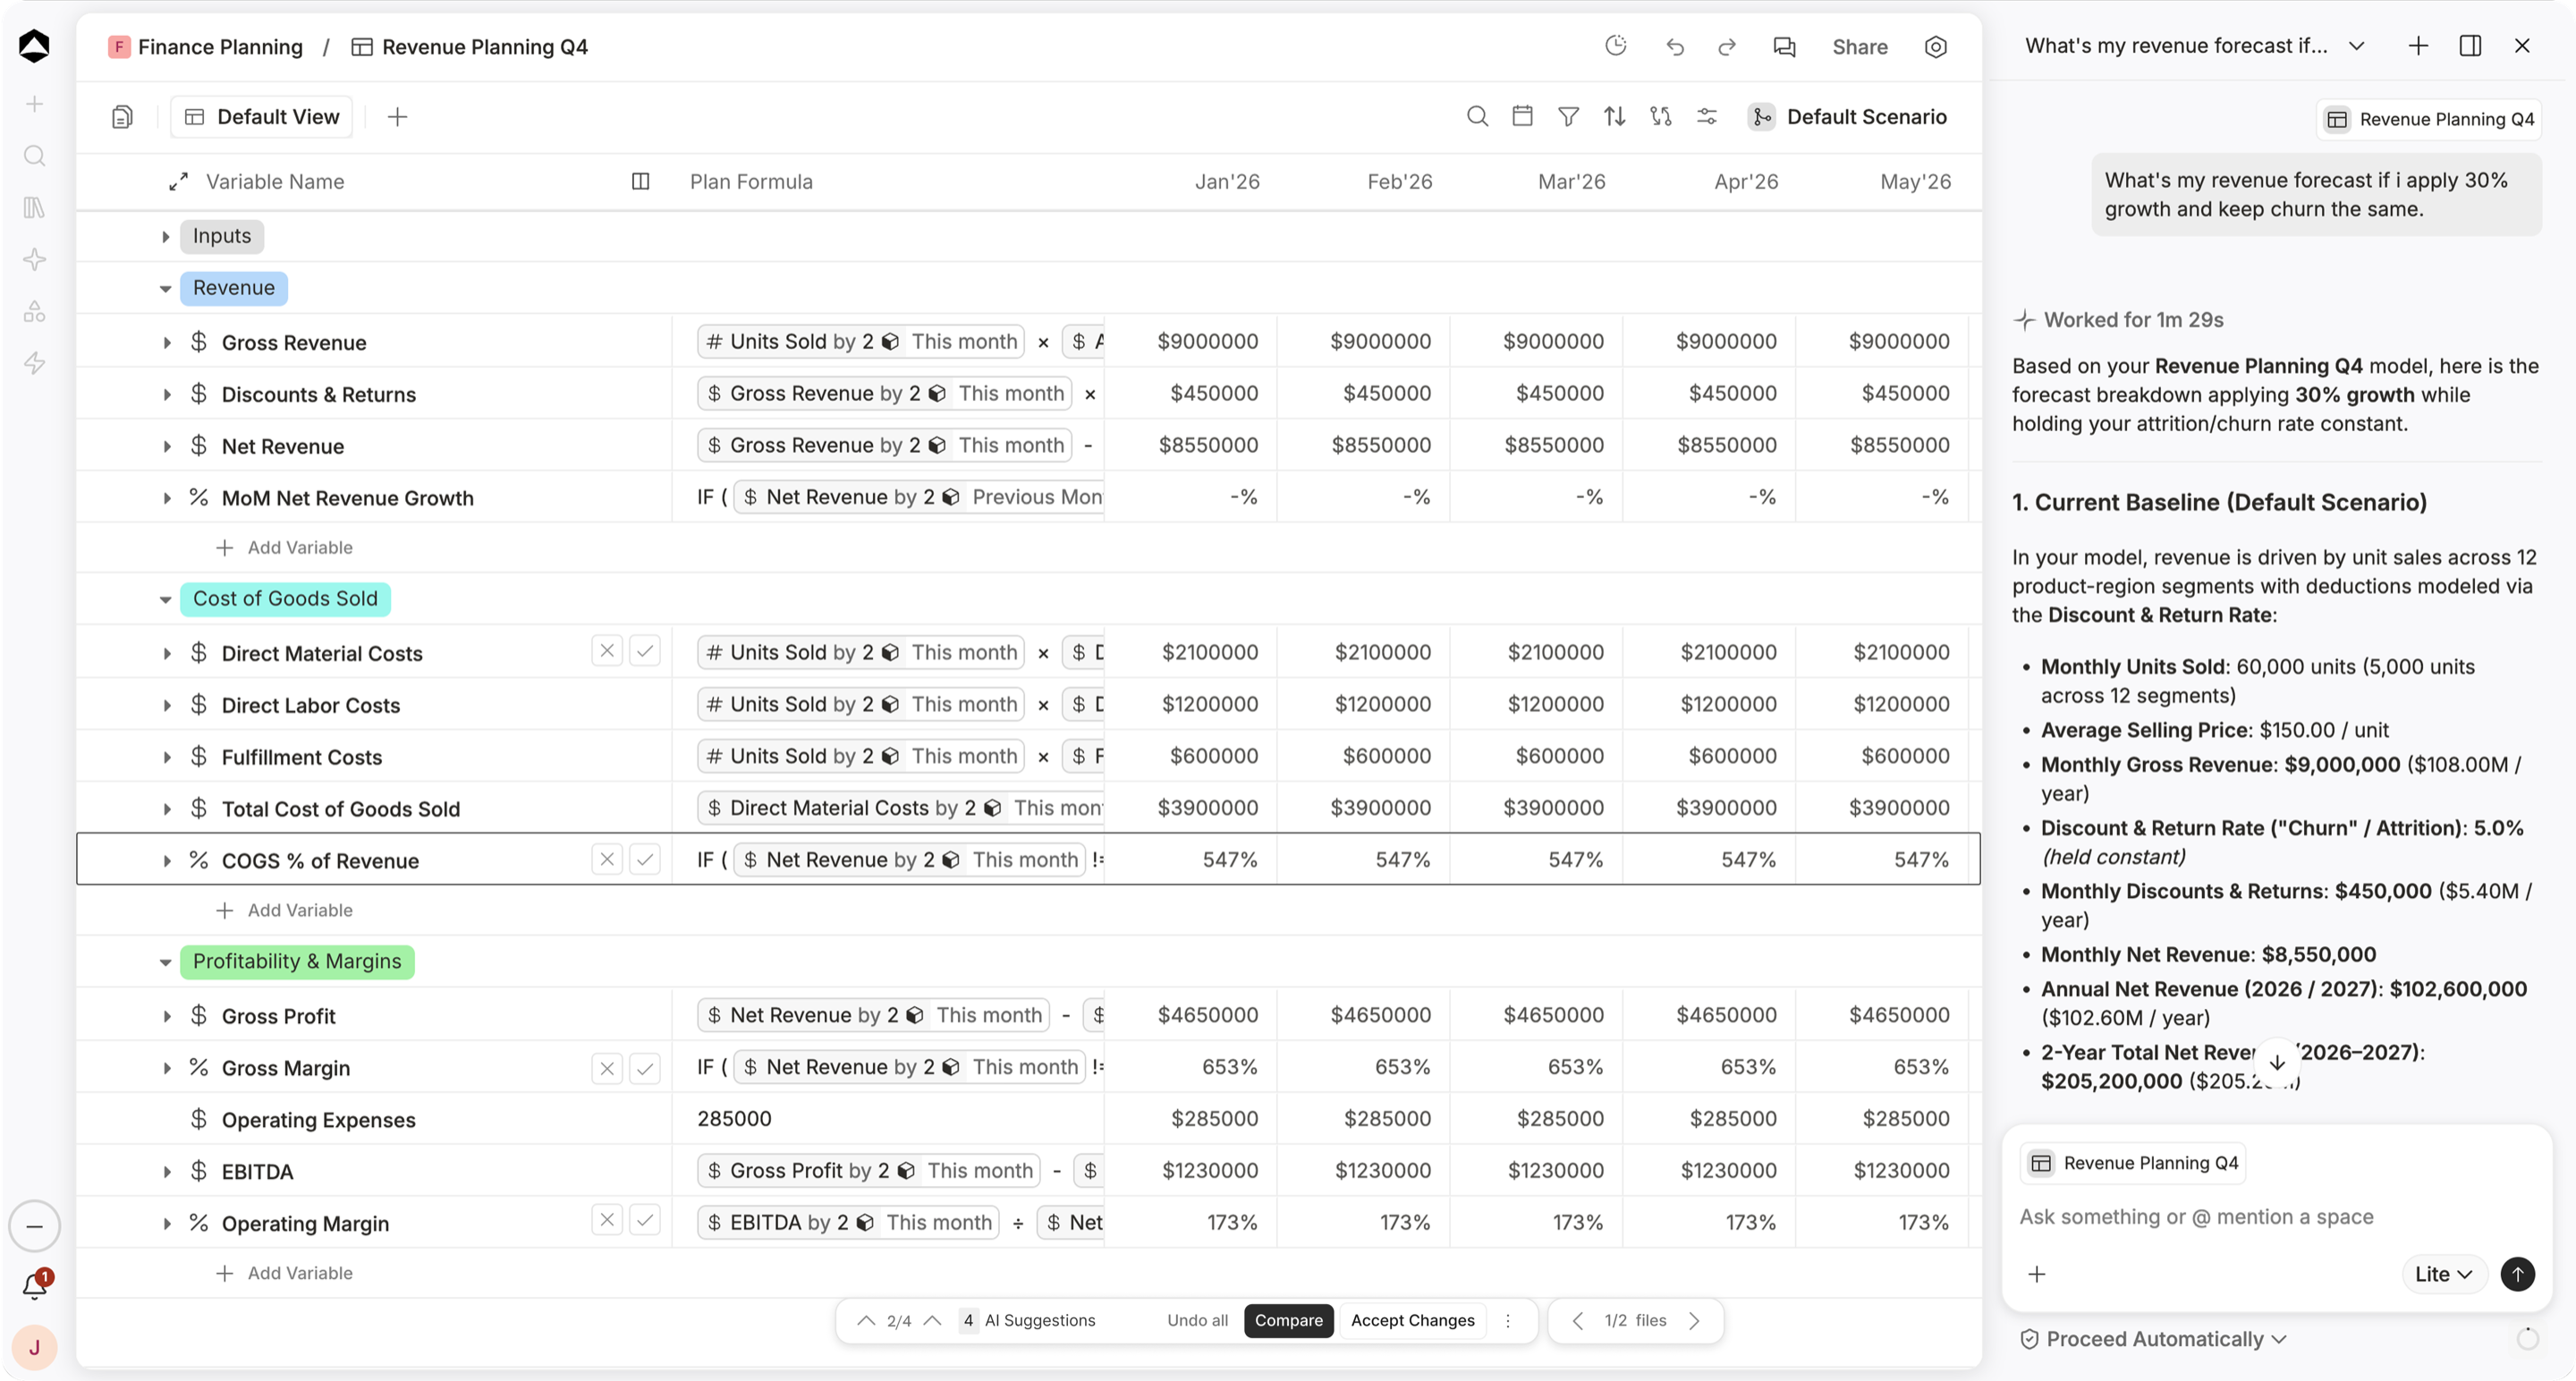
Planning choices
Plan the wider business
Connect revenue assumptions to operating costs and cash.
Explore scenarios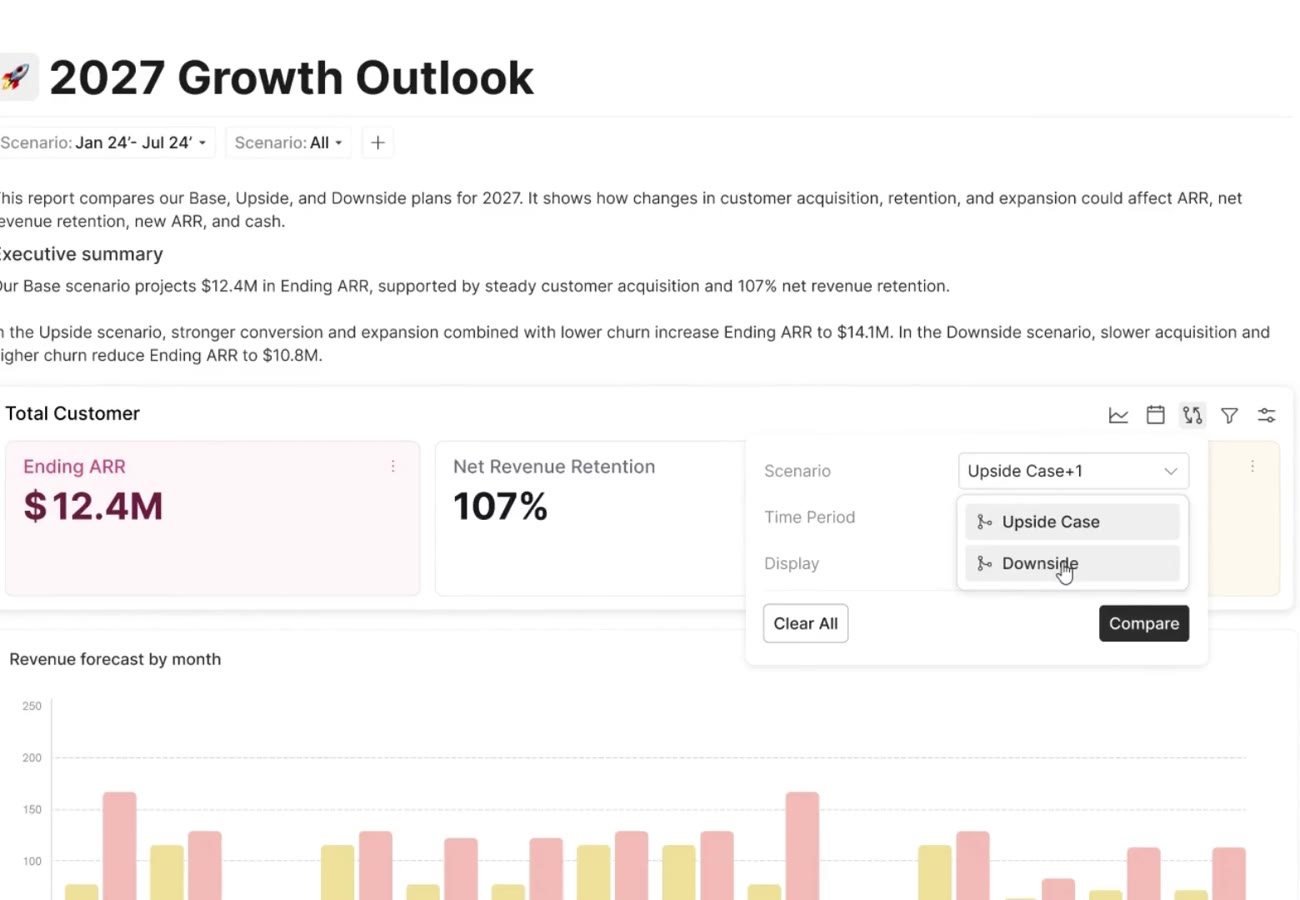
Shared review
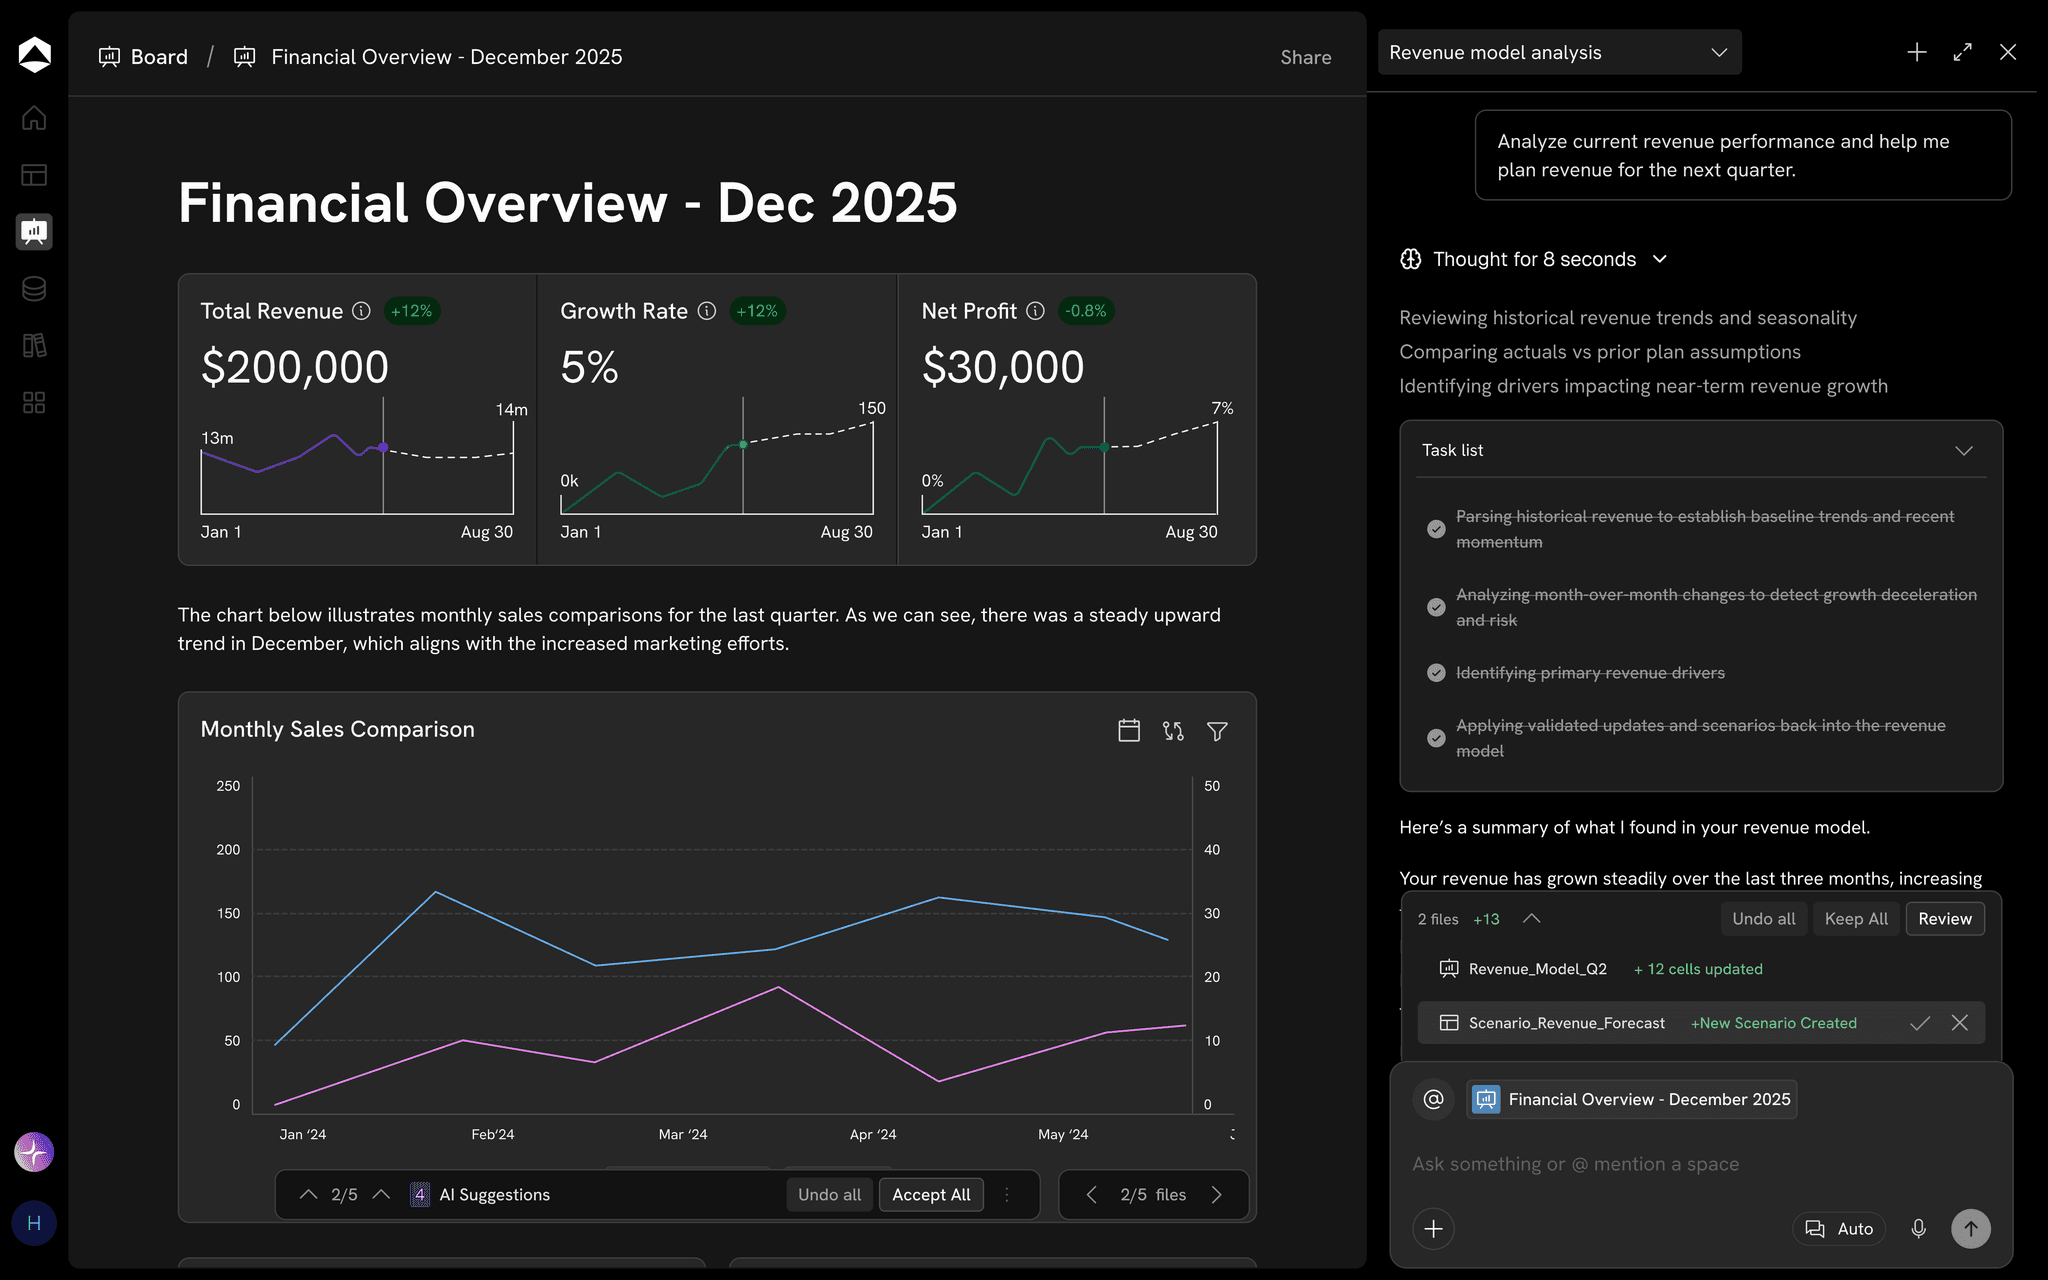
Review the full economics
Challenge customer-volume response and the excluded costs, then review settlement timing before adopting new pricing.
Explore shared boards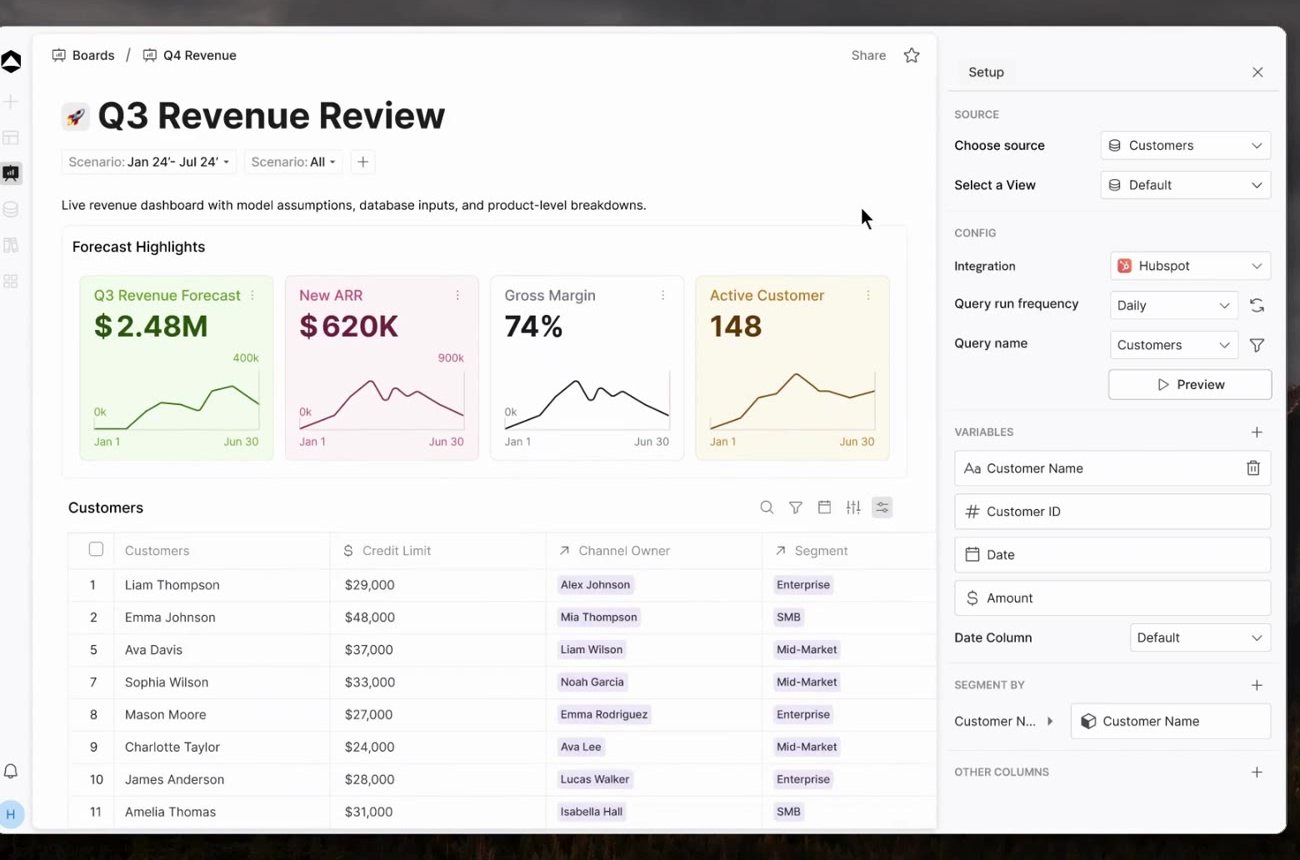
One connected financial picture
What does a 0.10-point take-rate change earn on $40M?
Challenge customer-volume response and the excluded costs, then review settlement timing before adopting new pricing.
Explore the transaction economics example
Net take rate = gross take rate − processing fee rate. Net transaction revenue = payment volume × net take rate.
October 2026 · sample payment period · Illustrative dataTHE ECONOMICS IN VIEW
What does a 0.10-point take-rate change earn on $40M?
Payment volume by month
$ millions$40M volume × 0.80% net take rate = $320K after processing fees. Losses and other delivery costs are excluded.
Inspect the model inputs3 model lines
| Economic driver | Current pricing | Pricing alternative | Definition |
|---|---|---|---|
| 1.40% | 1.50% | Customer pricing | |
| 0.60% | 0.60% | Modeled variable fees | |
| 0.80% | 0.90% | Gross less processing |
Scroll to inspect all columns
This is a payments example. Fraud/losses, funding costs, settlement timing, and other delivery costs are excluded; it does not represent banking or lending workflows.
A little more context
Questions about Fintech.
How do transaction volume and revenue stay distinct?
Payment volume is an operating driver. Take rates, processing costs, and other assumptions connect it to revenue and contribution. Keep the scope of gross and net metrics clear by product and market.
Does this example cover every fintech business model?
No. It models a payments business. Lending, banking, underwriting, and regulated operating workflows require different definitions and are not demonstrated here.
What should we agree before comparing plans?
Net take rate = gross take rate − processing fee rate. Net transaction revenue = payment volume × net take rate.
Where can we find a starting model?
Explore templates for planning, revenue, cash, headcount and reporting. Adapt the assumptions and structure to your business, and agree access with the people who will review the work.
Explore templates