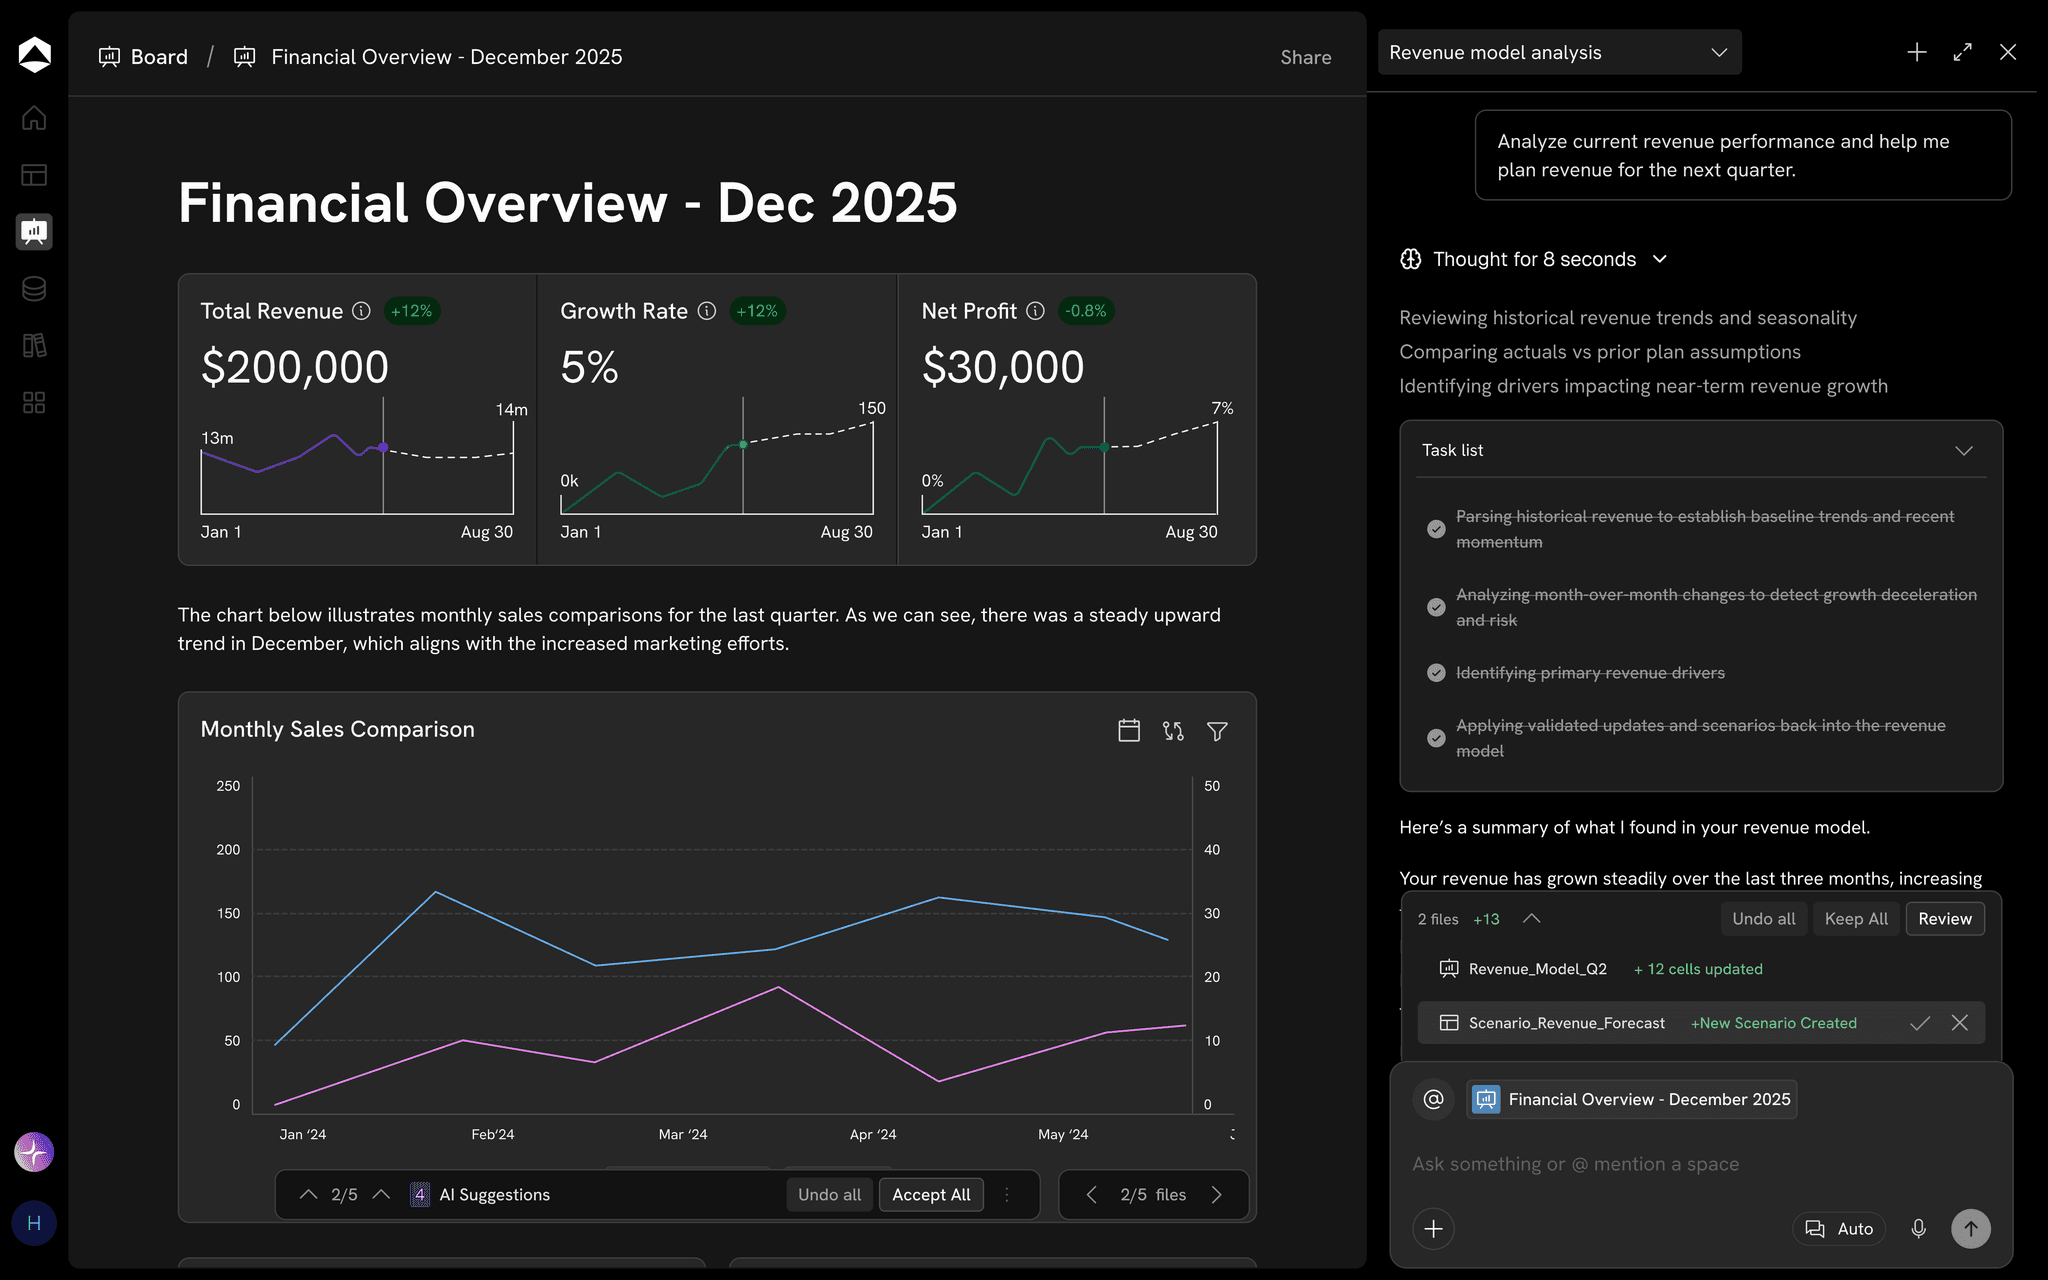
Use cases · Oculon for Board & Management Reporting
Board & Management ReportingBring the decision into the board story.
Show performance, the explanation behind it, and the choices that need discussion. Give the meeting a financial narrative people can inspect.
The decision behind the work
Give the meeting a common starting point.
For Finance leaders and board presenters.
Establish the cutoff
Make the reporting period and model reference visible before the meeting.
Write the explanation
Put the movement and its business drivers beside the headline measures.
Name the open choices
Show who owns each decision and which assumptions still need review.
From context to the next move
Put the plan to work.
Keep the inputs, model and review connected around the work in front of you.
Connected inputs
Build the shared view
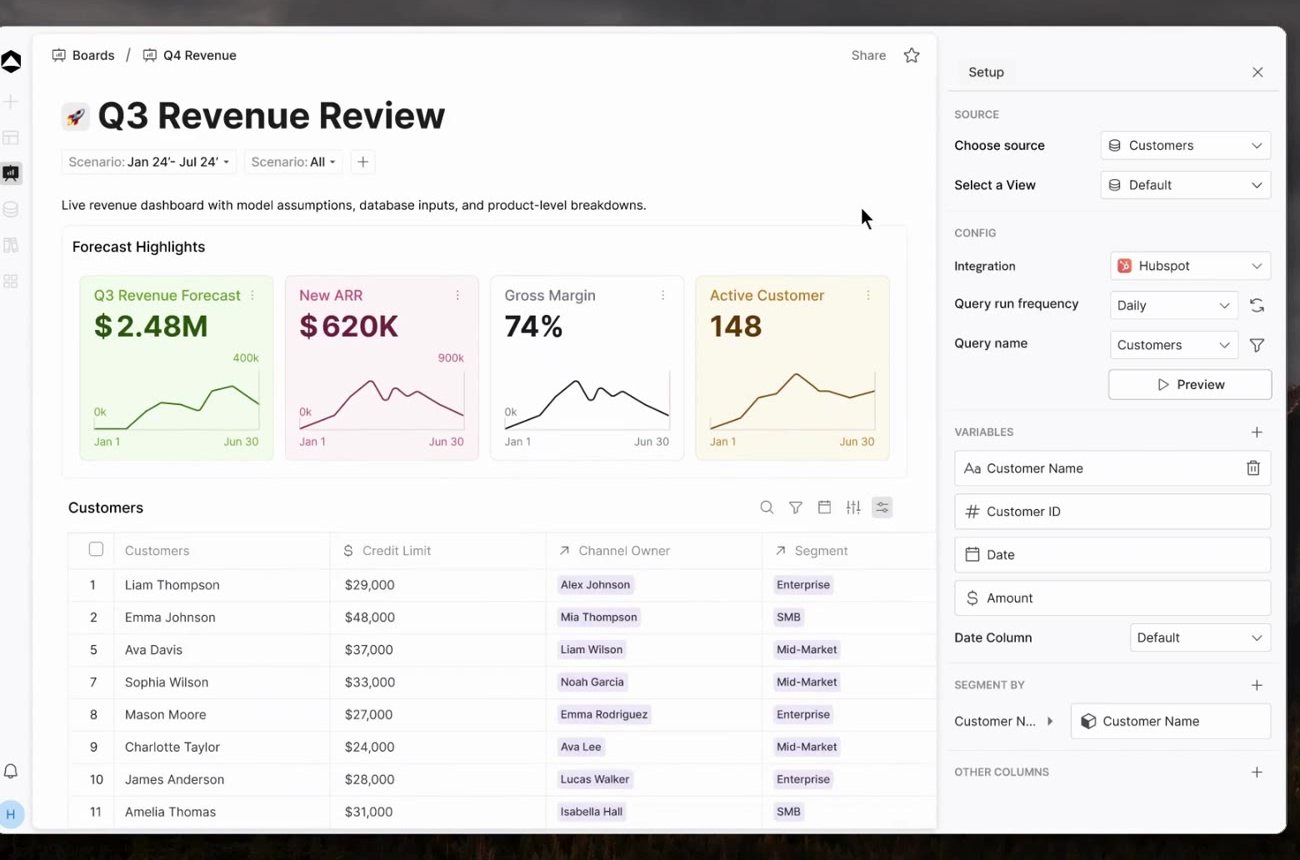
Bring financial and operating metrics into a board built for the audience.
Explore connected data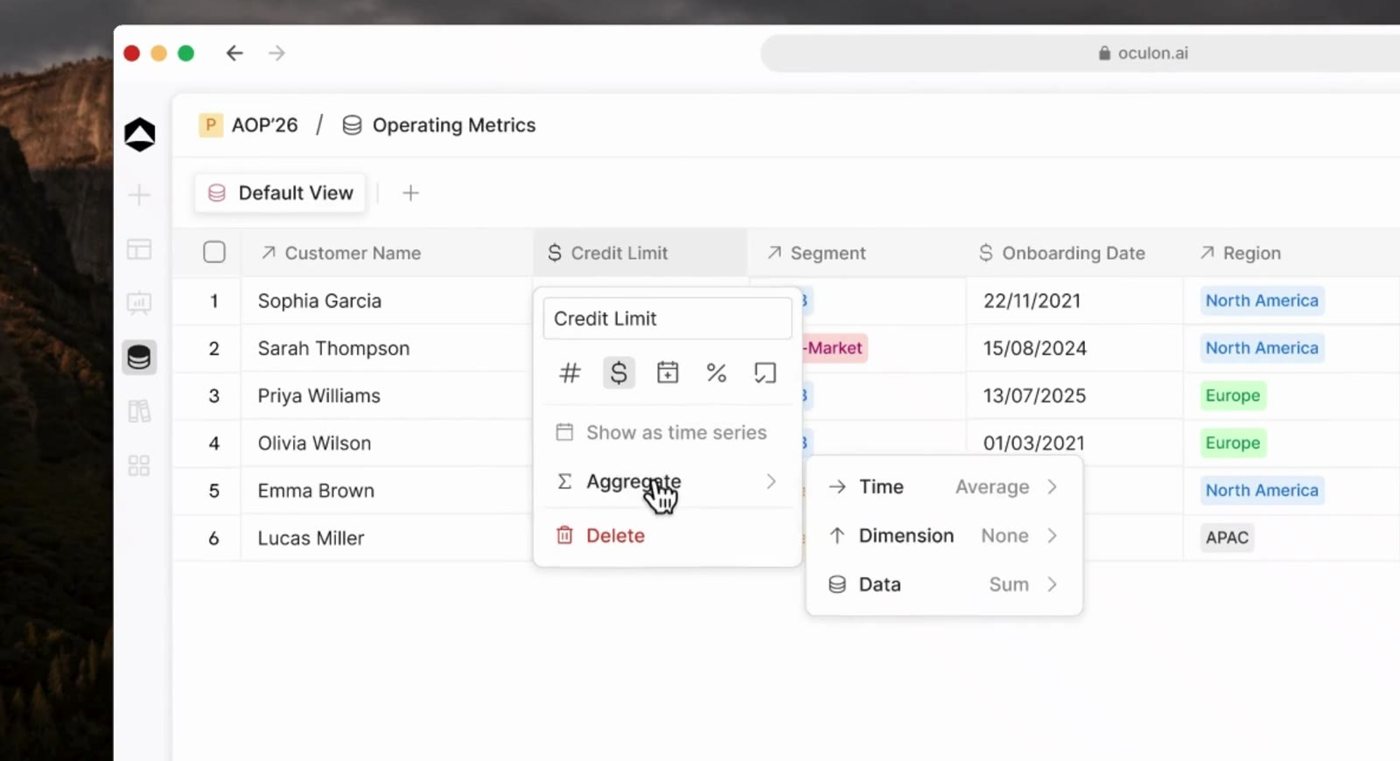
Business drivers
Keep the explanation close
Connect the financial narrative to the assumptions and analysis supporting it.
Explore financial models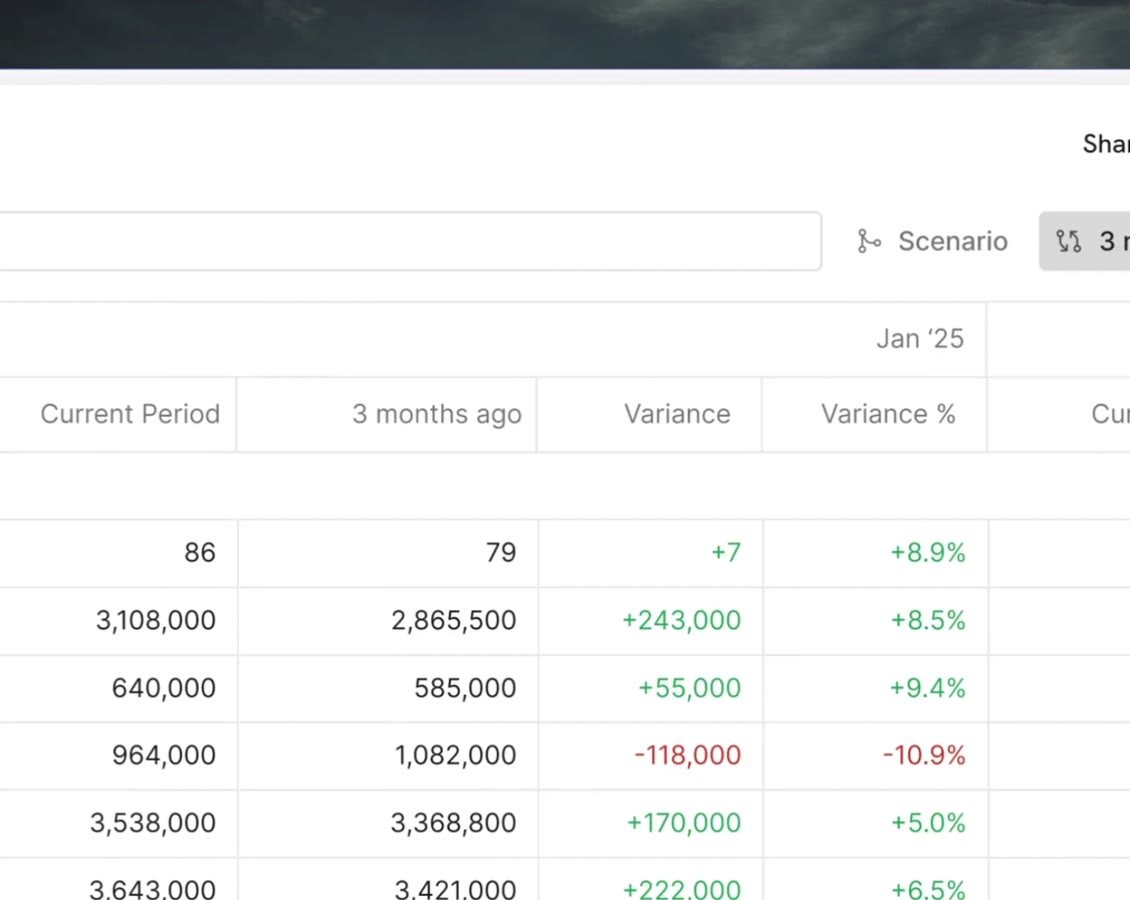
Planning choices
Share with context
Use artifacts and published views to bring the story to stakeholders.
Explore scenarios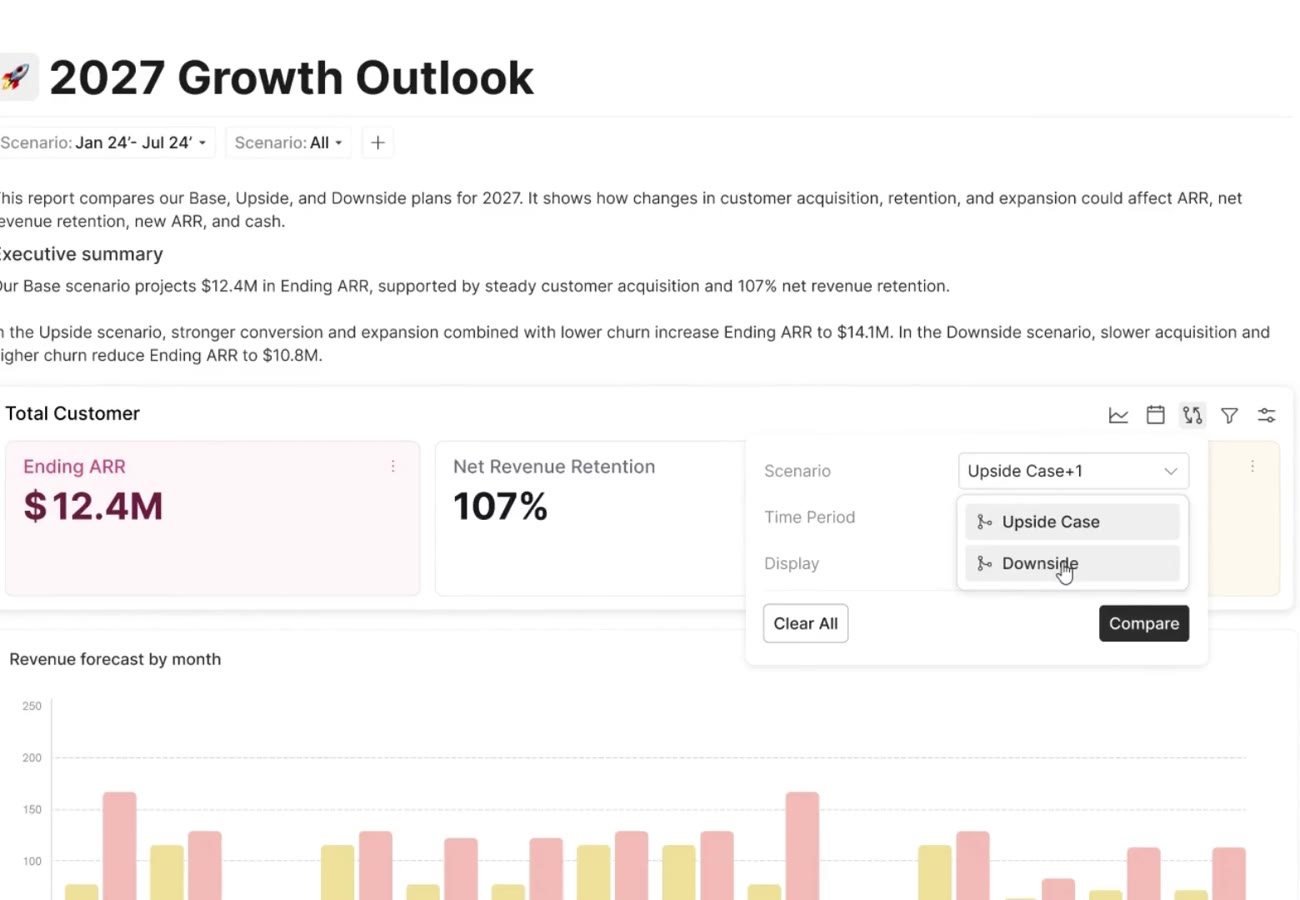
Shared review
Name the open choices
Agree the numbers and model cutoff, then discuss the sales-capacity assumption with its profit and cash consequences.
Explore shared boards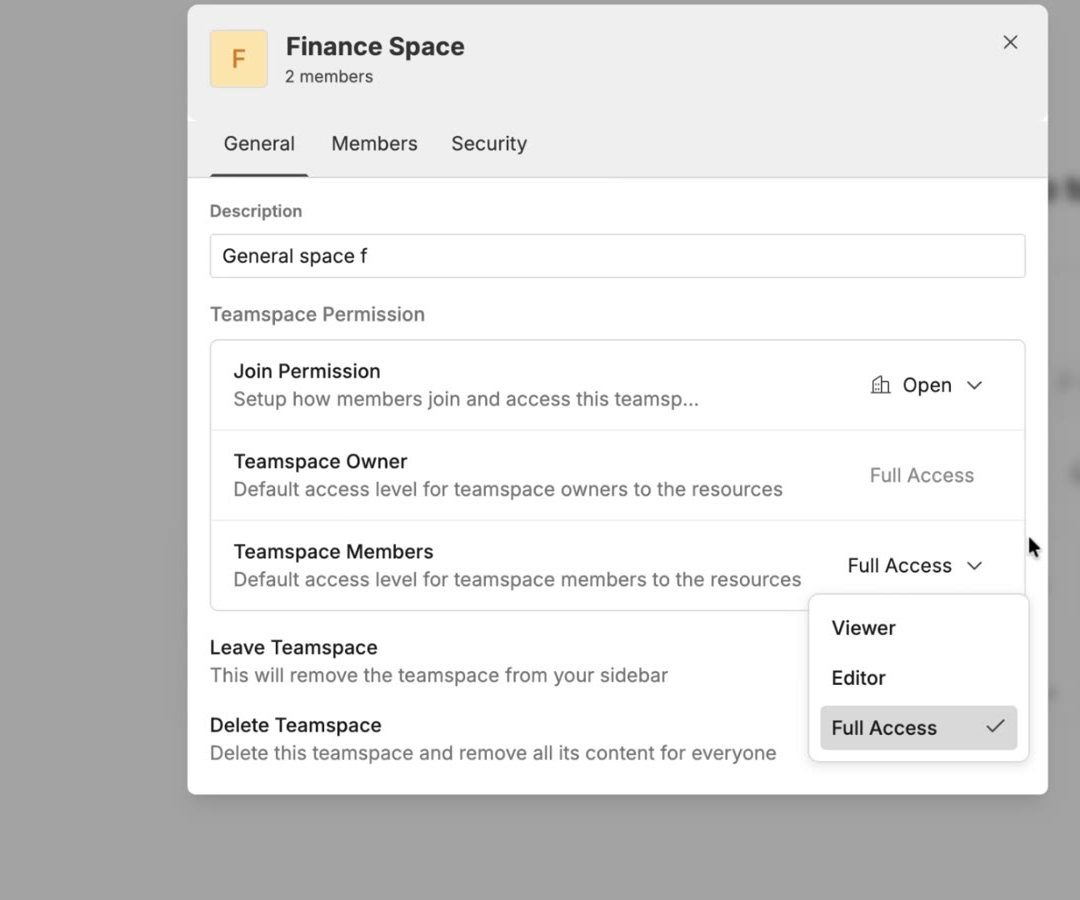
One connected financial picture
Does being ahead of plan justify more sales capacity?
Agree the numbers and model cutoff, then discuss the sales-capacity assumption with its profit and cash consequences.
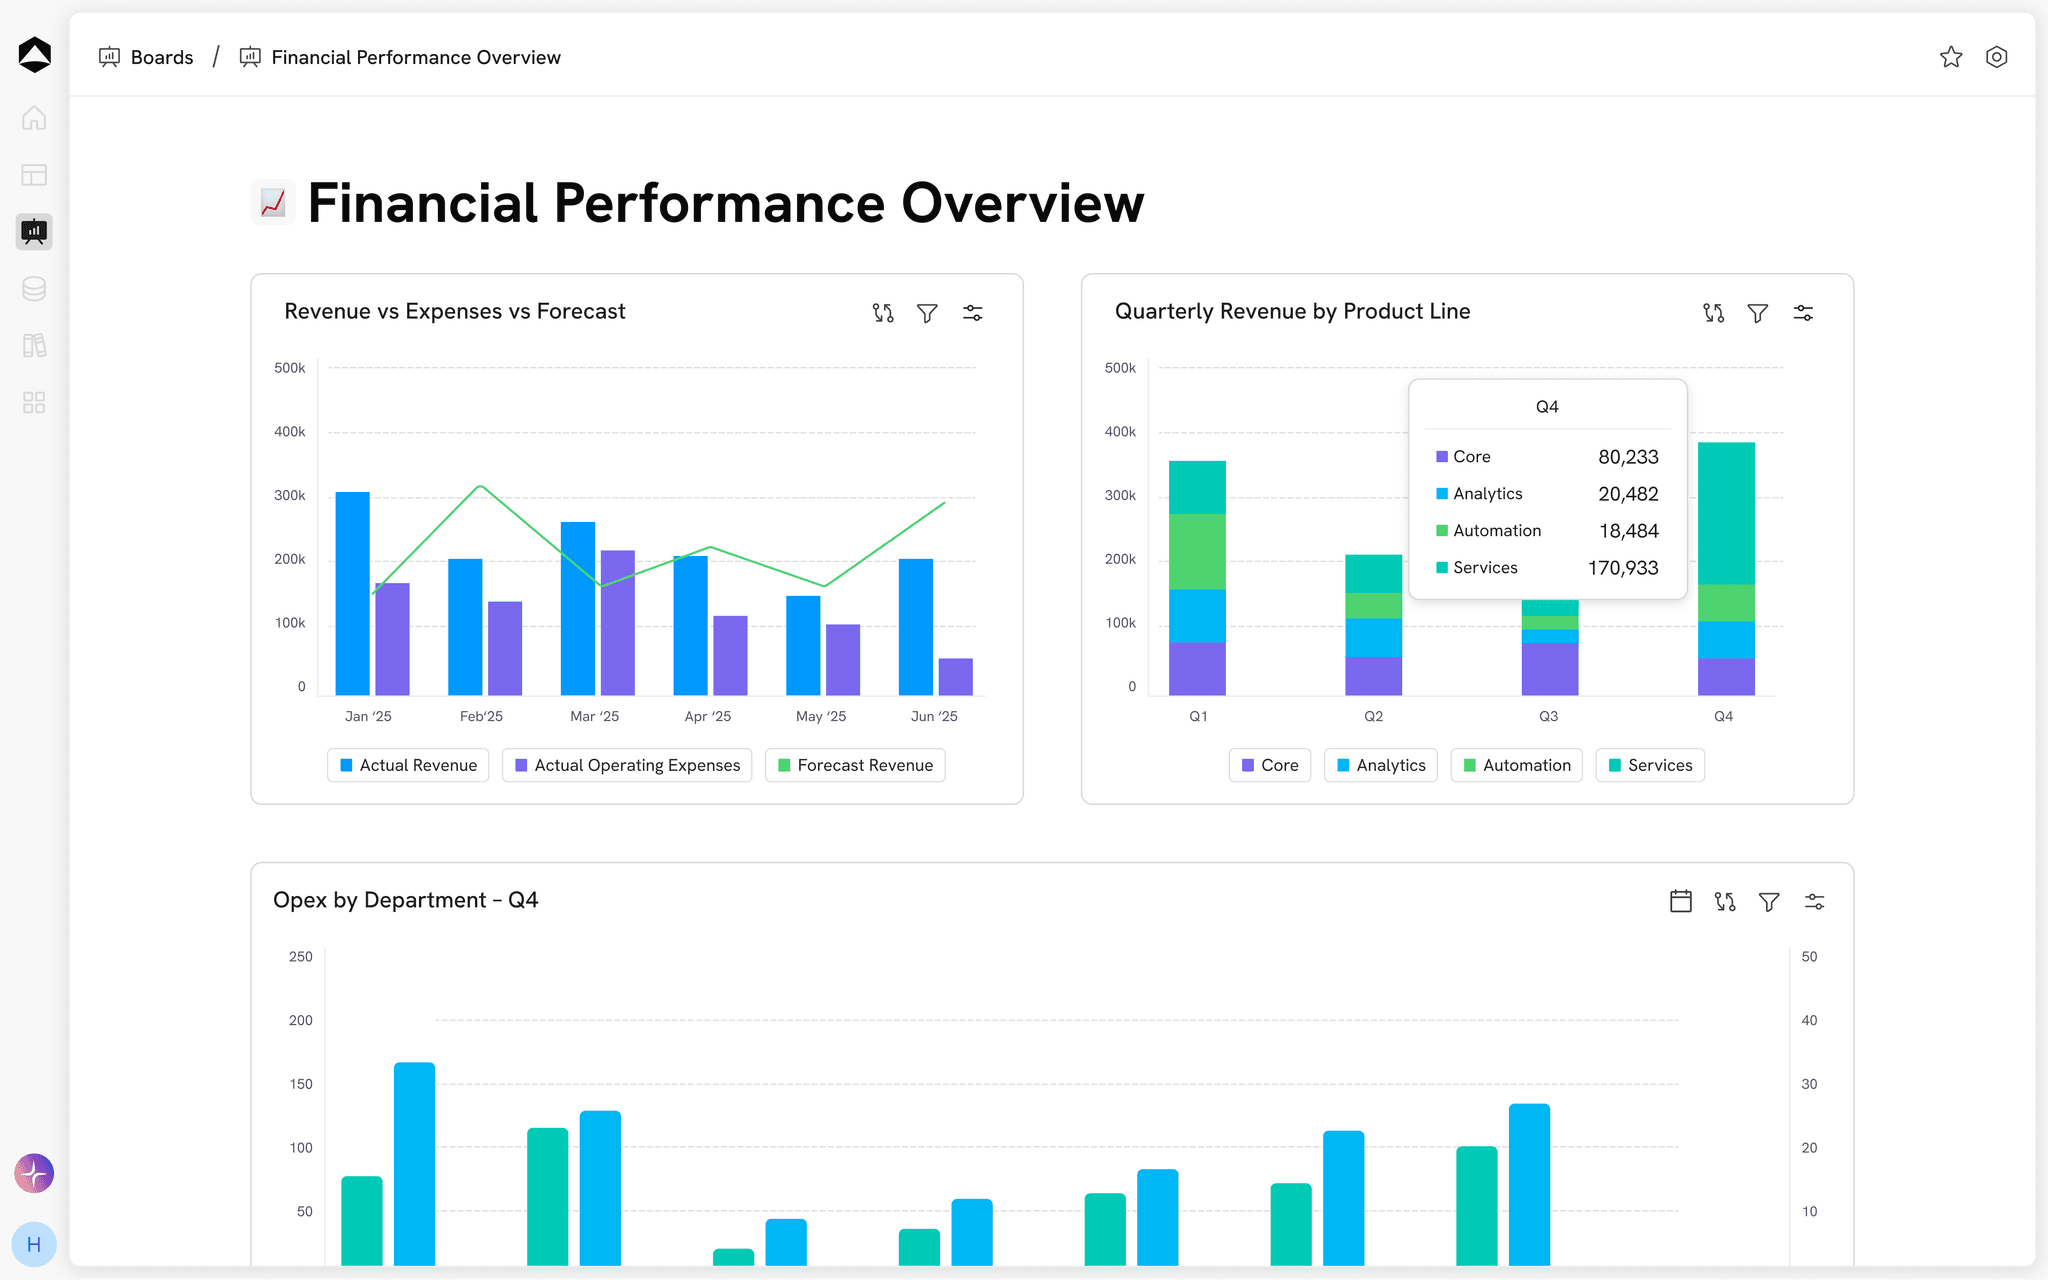
Explore the board meeting · october example
Quarter revenue is compared with a $4.6M plan. Gross margin is a separate 72% measure against a 70% target.
Q3 2026 close · October board review · Illustrative dataEXPLORE THE DECISION
Does being ahead of plan justify more sales capacity?
The meeting narrative
Connected report sectionsPerformance and the next growth choice
Q3 revenue of $4.8M is $200K above plan. Gross margin is 72%, two percentage points above the 70% target.
Inspect the model inputs3 model lines
| Report section | Narrative | Owner | Review |
|---|---|---|---|
| Performance & outlook | Finance | Ready | |
| Pipeline & retention | RevOps | Ready | |
| Proposed hiring plan | CFO | In review |
Scroll to inspect all columns
This is an illustrative meeting brief. Board templates, generated decks, secure publishing, and export formats need a workflow-specific availability discussion.
A little more context
Questions about Board & Management Reporting.
Can different audiences see different views?
Boards and permissions let teams organize reporting around the audience and its access needs. Review the sharing and approval setup for your board or management workflow with the Oculon team.
Can this brief be published or exported?
The page shows the information structure of a sample brief. Discuss the reporting, sharing, permissions, and export formats available for your workflow with the Oculon team; the illustration is not a working publishing portal.
What should we agree before comparing plans?
Quarter revenue is compared with a $4.6M plan. Gross margin is a separate 72% measure against a 70% target.
Where can we find a starting model?
Explore templates for planning, revenue, cash, headcount and reporting. Adapt the assumptions and structure to your business, and agree access with the people who will review the work.
Explore templates