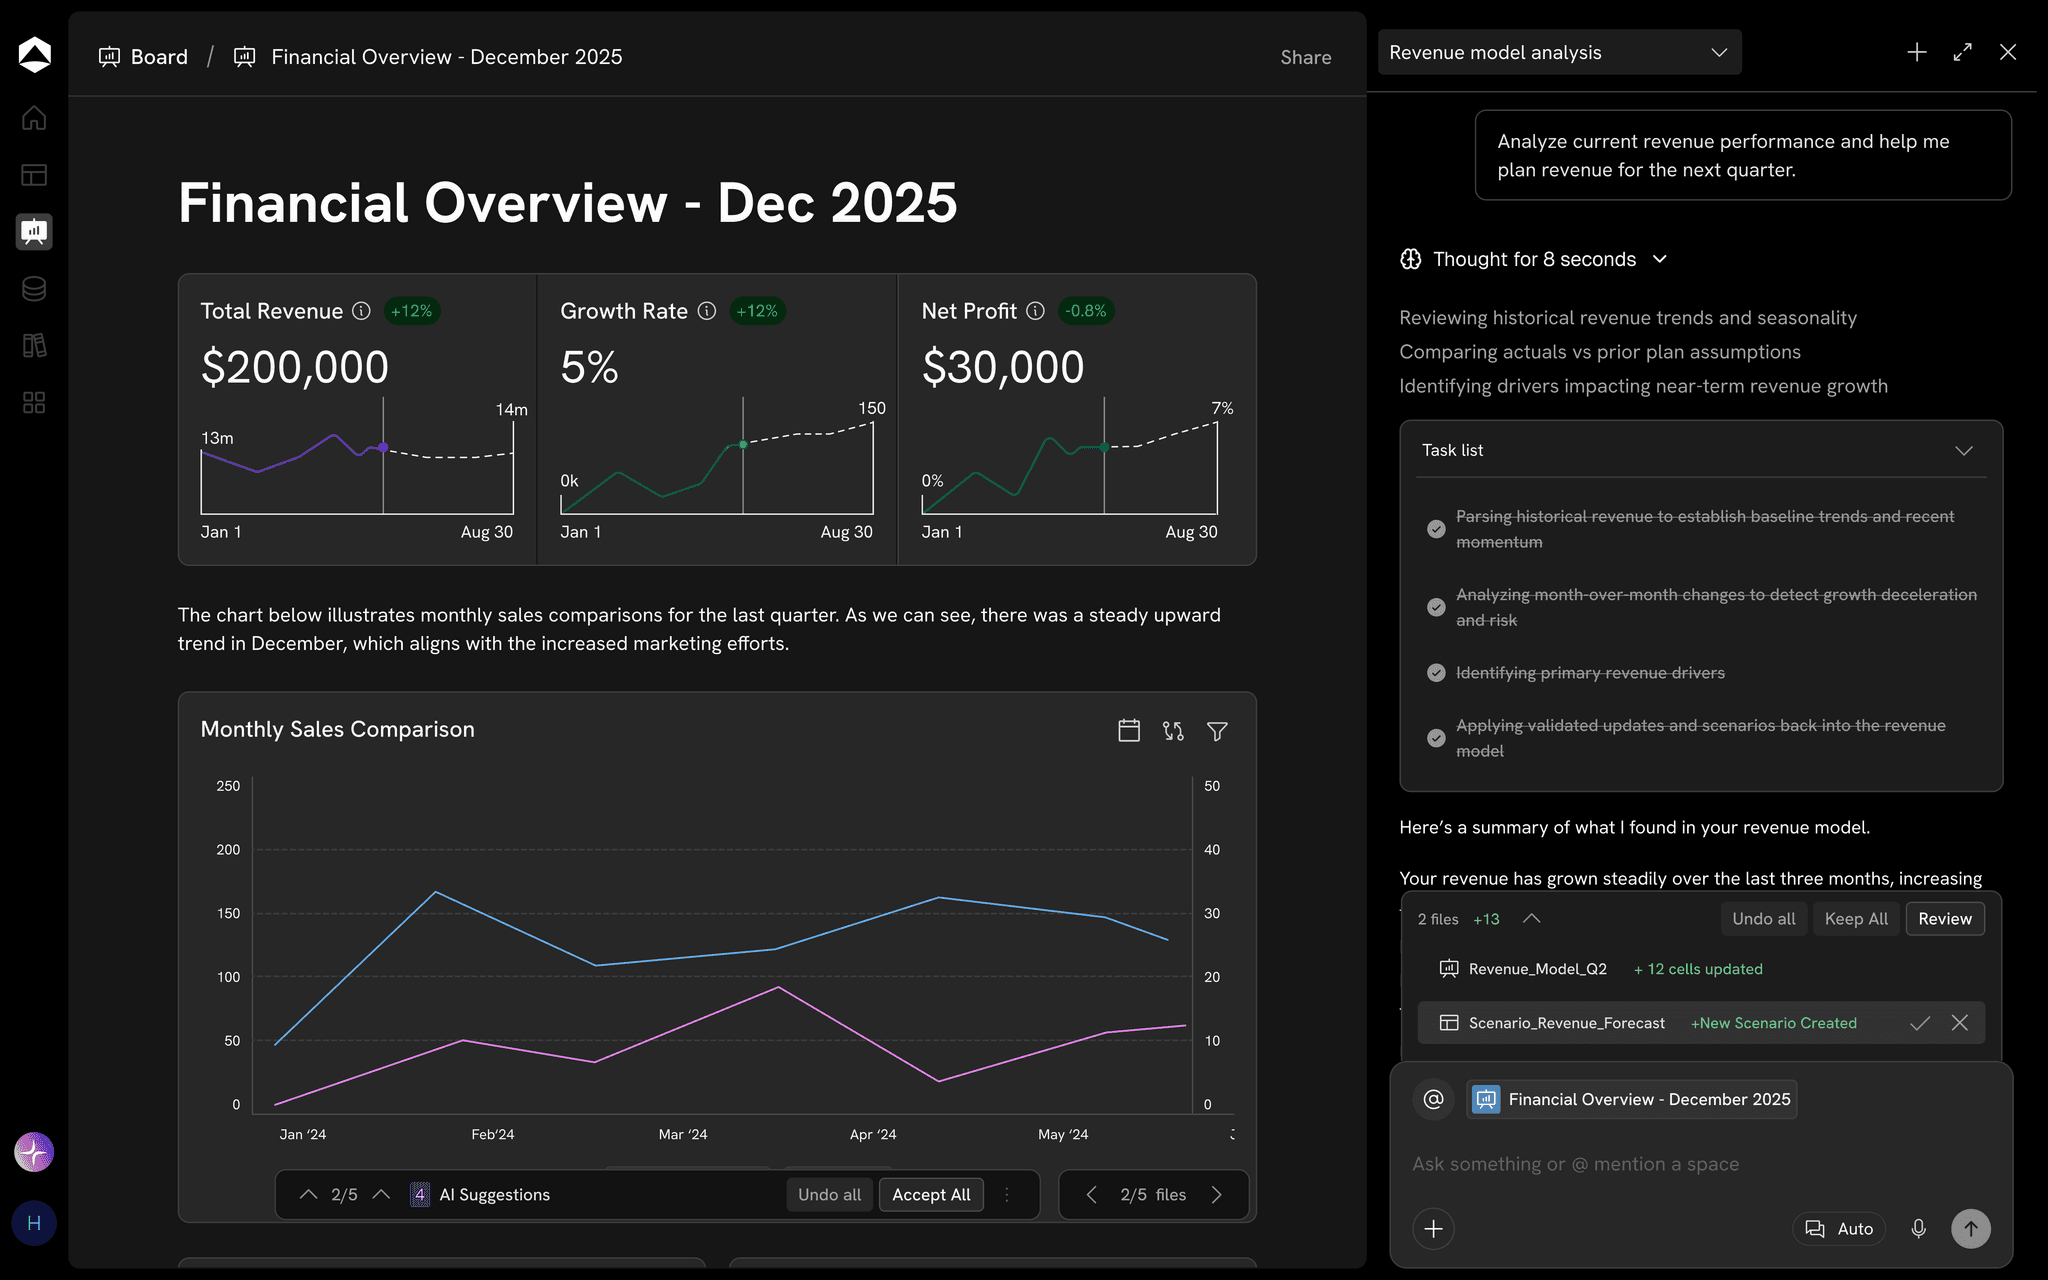
Industries · Oculon for Manufacturing
ManufacturingMake the production choice a financial choice.
Volume, materials, labor, and overhead belong in the same conversation. Compare the unit-cost change before committing the production plan.
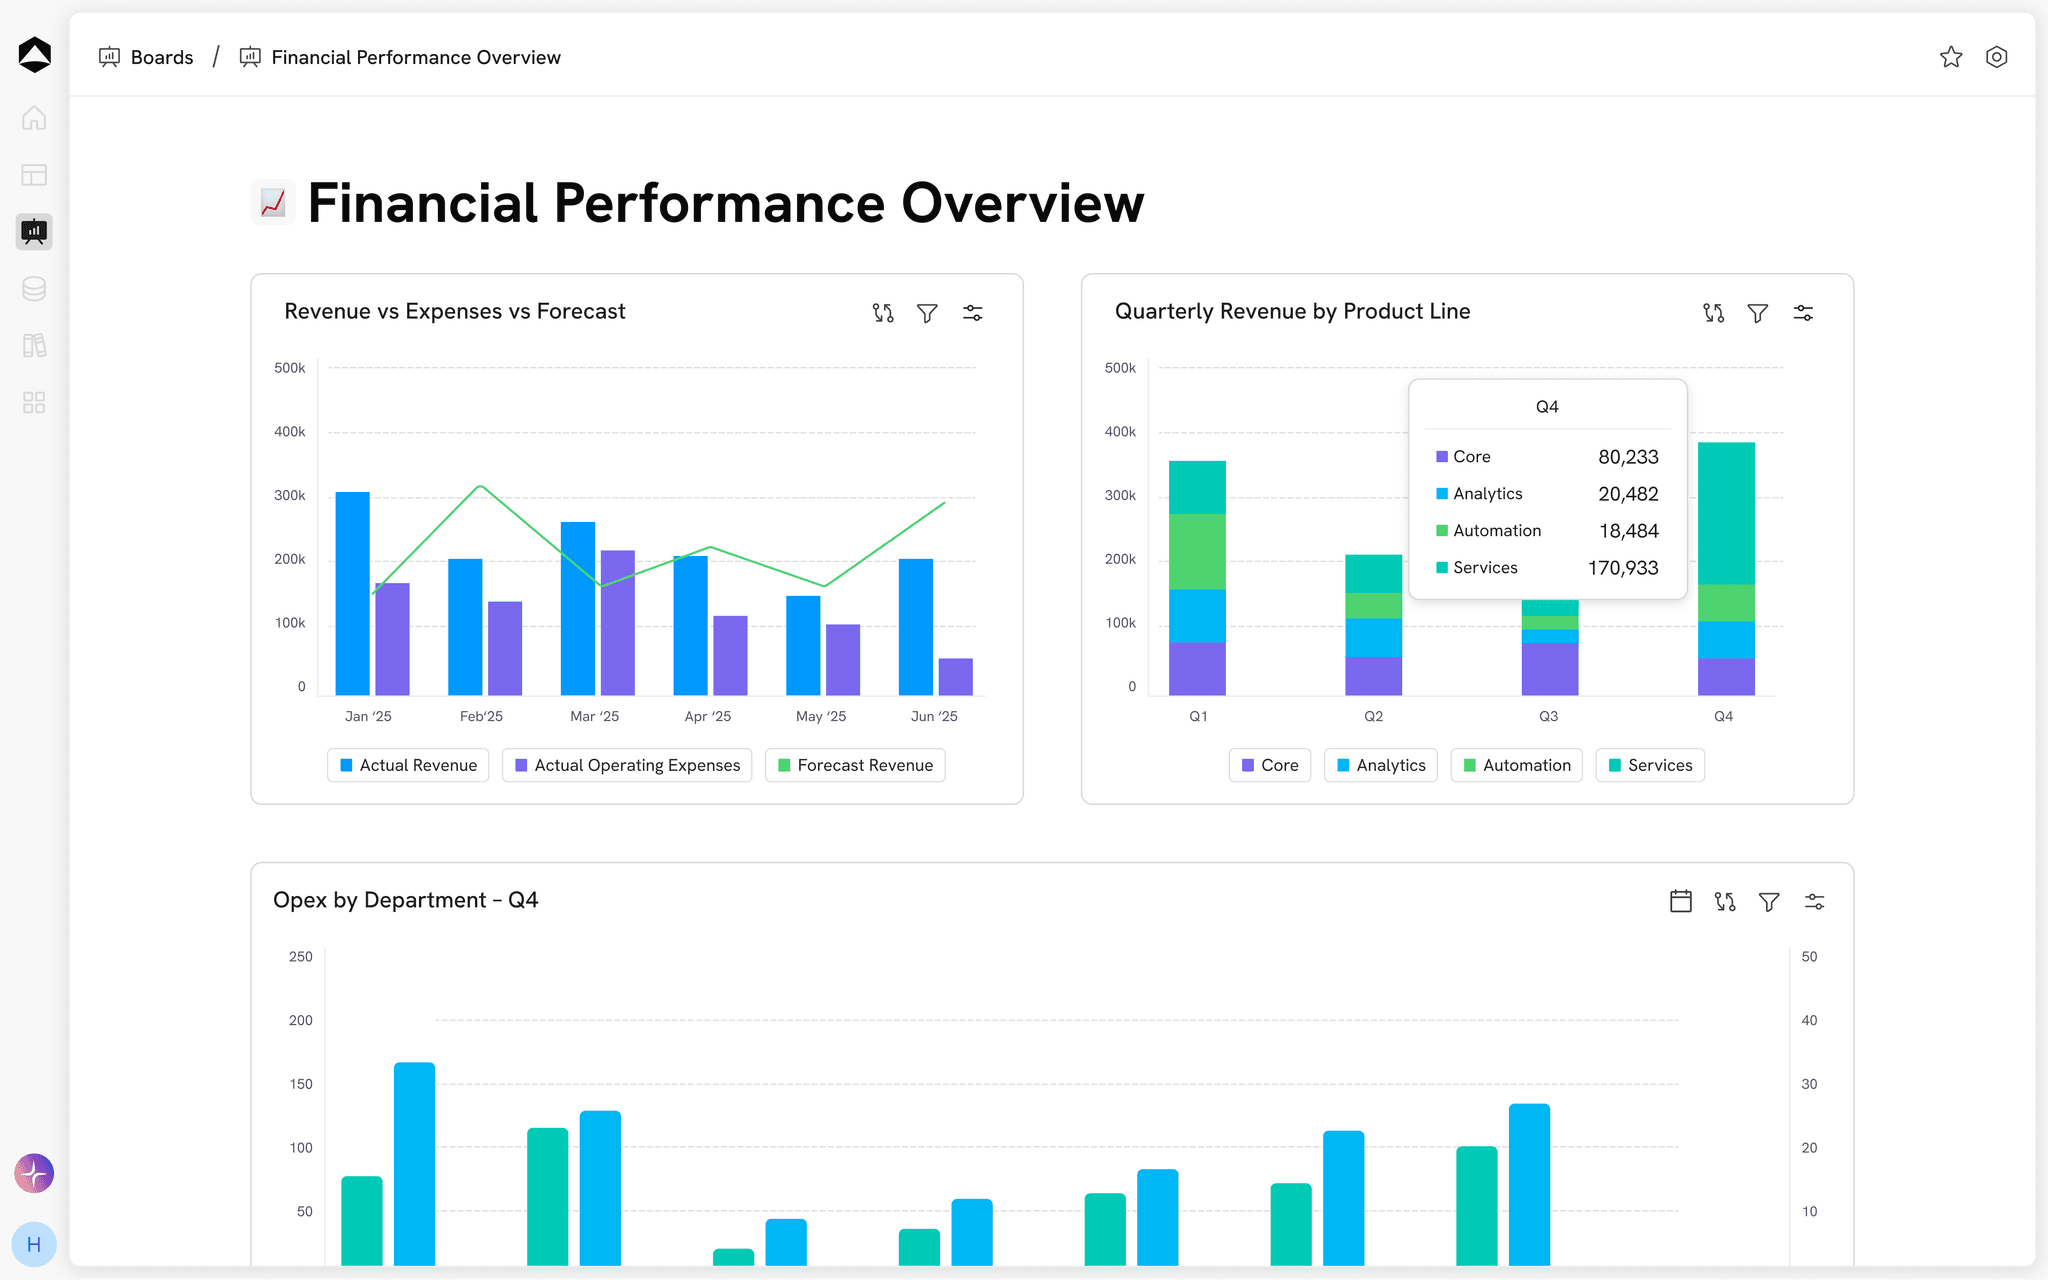
The business behind the numbers
Keep the operating choice connected to margin and cash.
For Manufacturing finance and operations.
Build up the unit cost
Make each component visible instead of presenting capacity utilization as the complete financial answer.
Isolate the alternative
Compare the materials choice while keeping the other cost drivers fixed.
Review the operating constraint
Bring quality, lead time, yield, and supplier commitments into the decision.
From context to the next move
Put the plan to work.
Keep the inputs, model and review connected around the work in front of you.
Connected inputs
Plan the capacity
Bring product volume and plant constraints into one operating outlook.
Explore connected data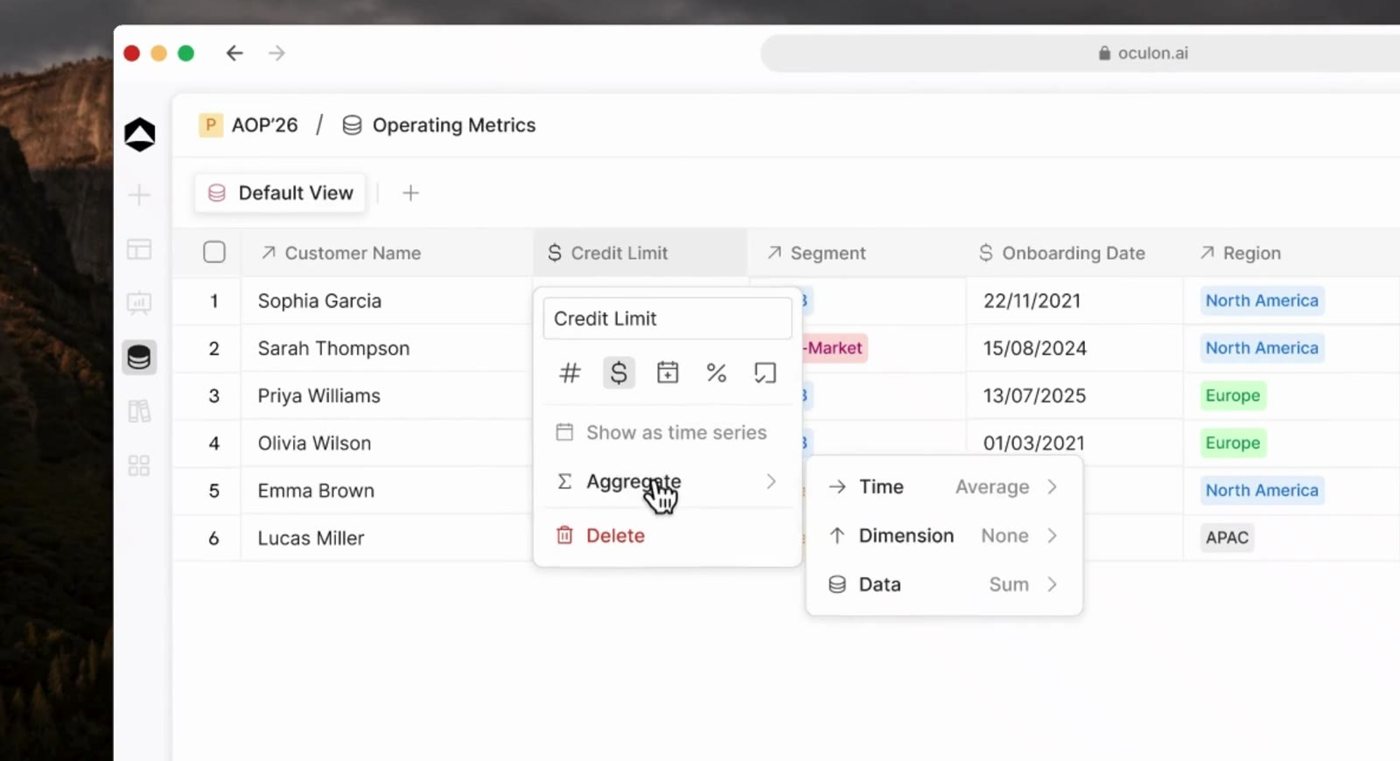
Business drivers
Model the unit cost
Review materials, labor, overhead, and yield assumptions in context.
Explore financial models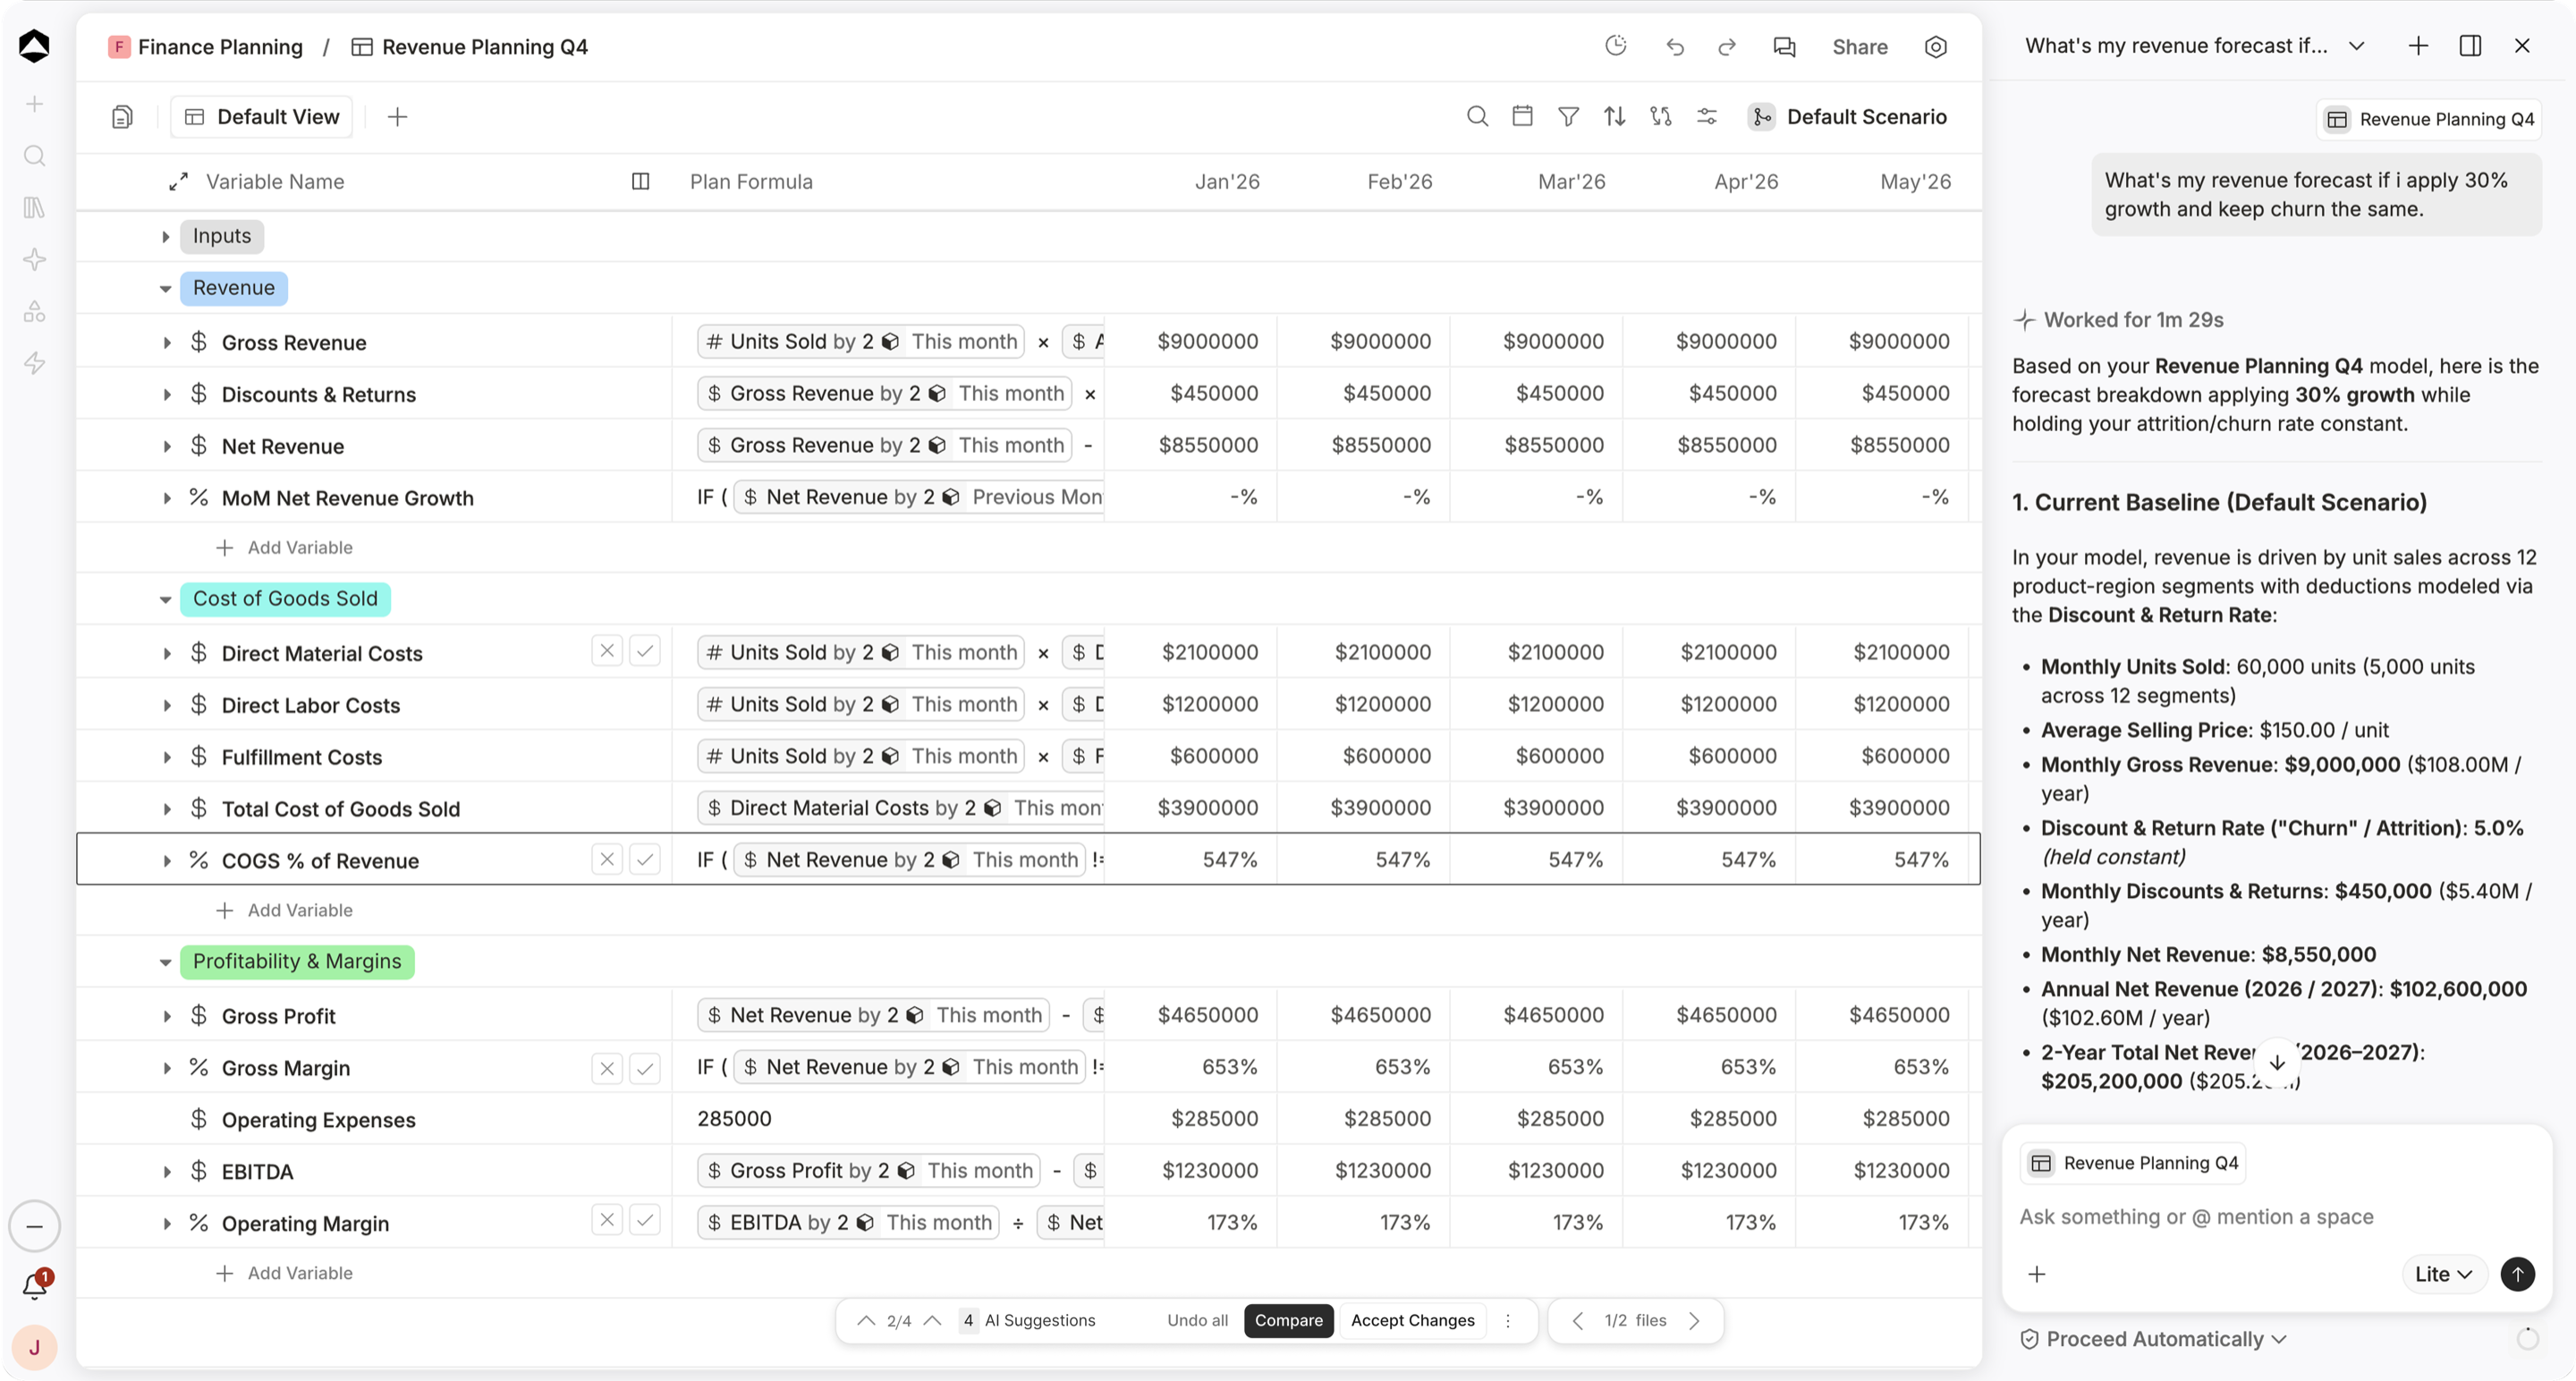
Planning choices
Review the cash commitment
Connect purchasing and production timing to working capital.
Explore scenarios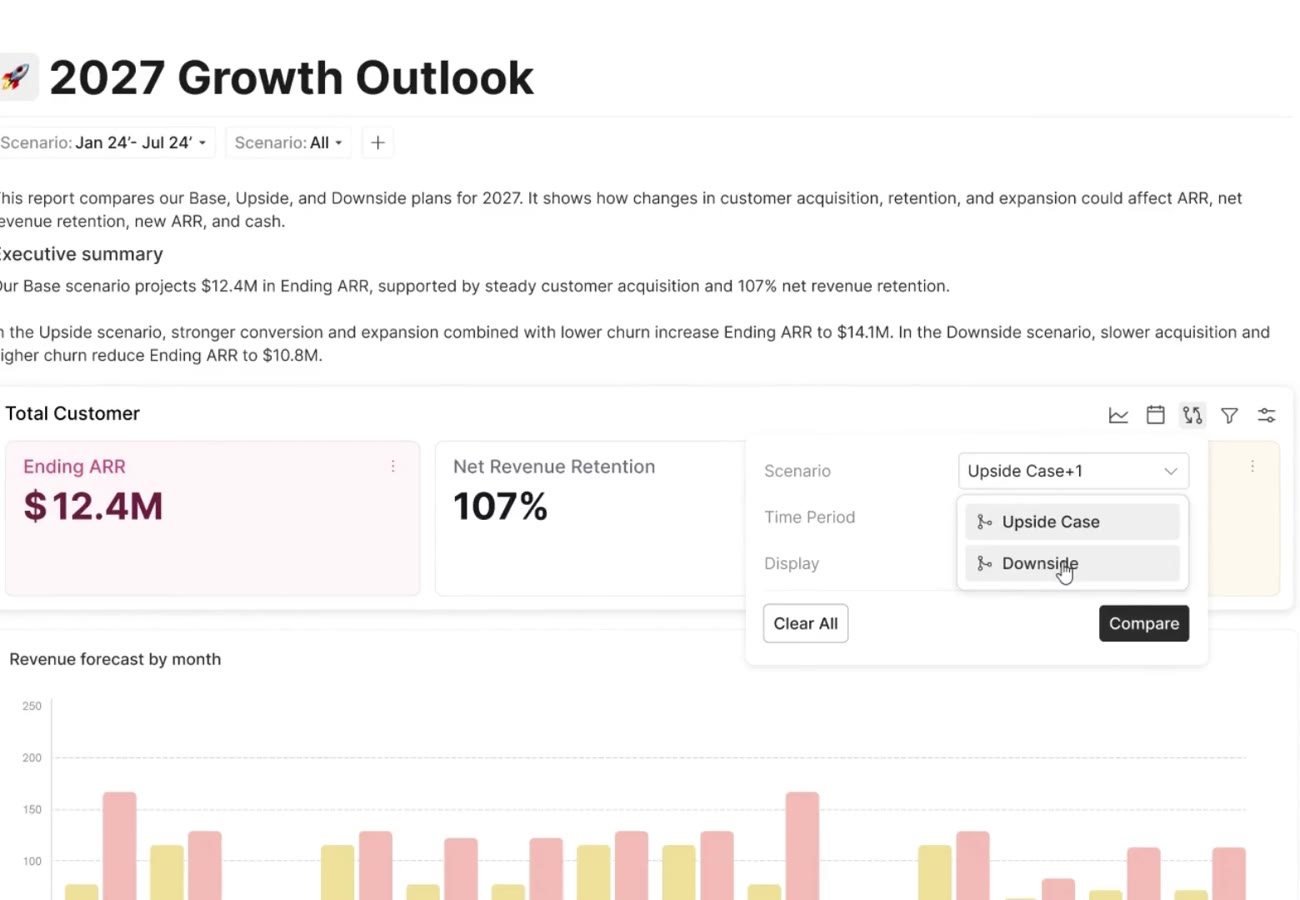
Shared review
Review the operating constraint
Review supplier quality, lead time, yield, and payment commitments before choosing the lower material-cost assumption.
Explore shared boards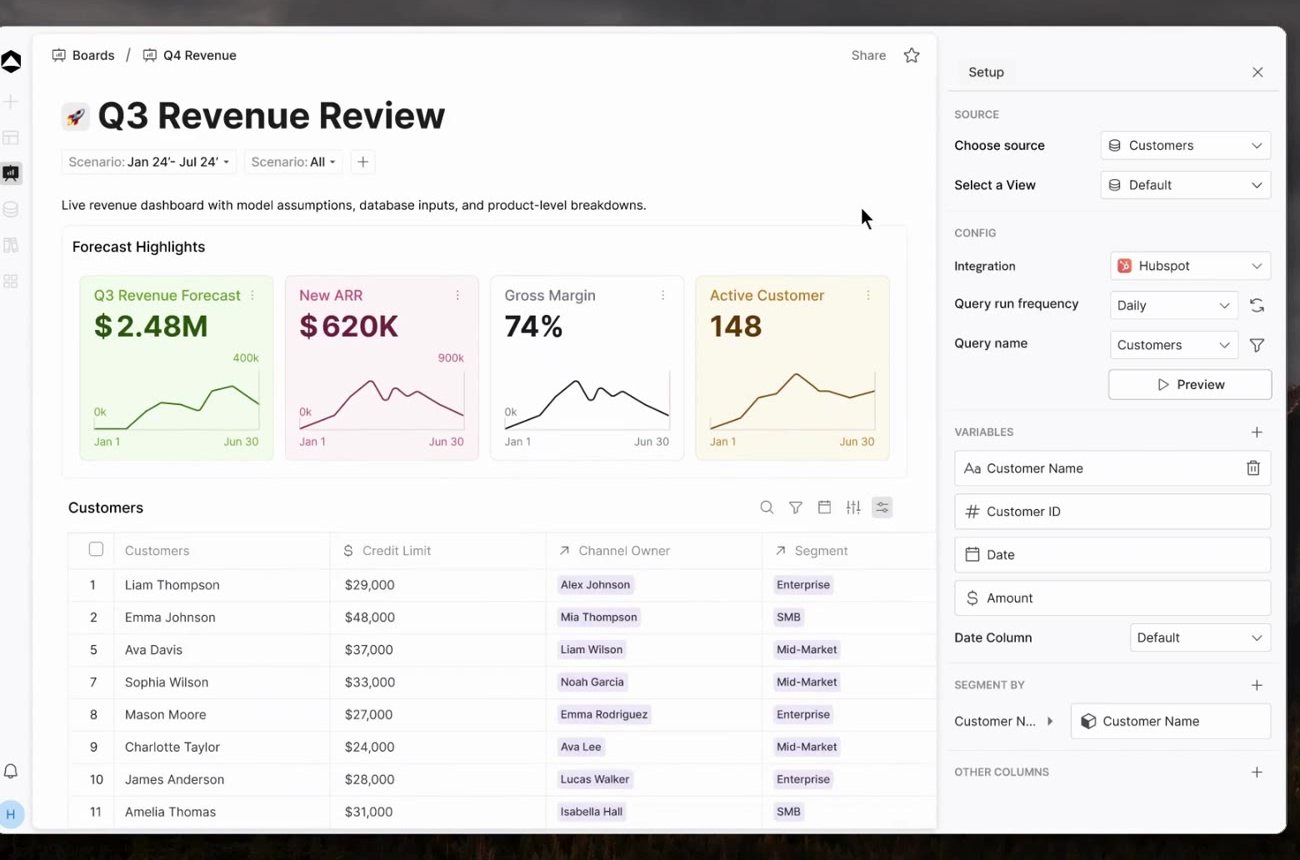
One connected financial picture
What is a $3 material reduction worth across 10,000 units?
Review supplier quality, lead time, yield, and payment commitments before choosing the lower material-cost assumption.
Explore the production economics example
Unit cost = materials + direct labor + applied overhead. Total production cost = planned units × unit cost.
October 2026 · 10,000-unit plan · Illustrative dataTHE ECONOMICS IN VIEW
What is a $3 material reduction worth across 10,000 units?
Unit-cost build-up
USD / unitInspect the model inputs3 model lines
| Unit-cost driver | Current mix | Material alternative | Context |
|---|---|---|---|
| $38 | $35 | Per unit | |
| $16 | $16 | Per unit | |
| $10 | $10 | Per unit |
Scroll to inspect all columns
The comparison holds volume, yield, labor, and overhead fixed. It does not include selling price or assert a cash saving before purchase and payment timing are reviewed.
A little more context
Questions about Manufacturing.
Does this replace production scheduling or an ERP?
The page illustrates financial planning around production assumptions. Existing execution systems can remain the source of scheduling, orders, and transactions; Oculon connects that context to the financial plan.
Does a lower material cost automatically improve cash?
Not necessarily. Order quantities, payment terms, inventory timing, and yield can change the cash effect. The example isolates modeled production cost at a fixed volume.
What should we agree before comparing plans?
Unit cost = materials + direct labor + applied overhead. Total production cost = planned units × unit cost.
Where can we find a starting model?
Explore templates for planning, revenue, cash, headcount and reporting. Adapt the assumptions and structure to your business, and agree access with the people who will review the work.
Explore templates