Use cases · Oculon for Supply Chain & S&OP Planning
Supply Chain & S&OP PlanningPut a financial case behind the extra shift.
Demand exceeds capacity. Compare the additional output with its labor cost and inventory commitment before choosing the operating plan.
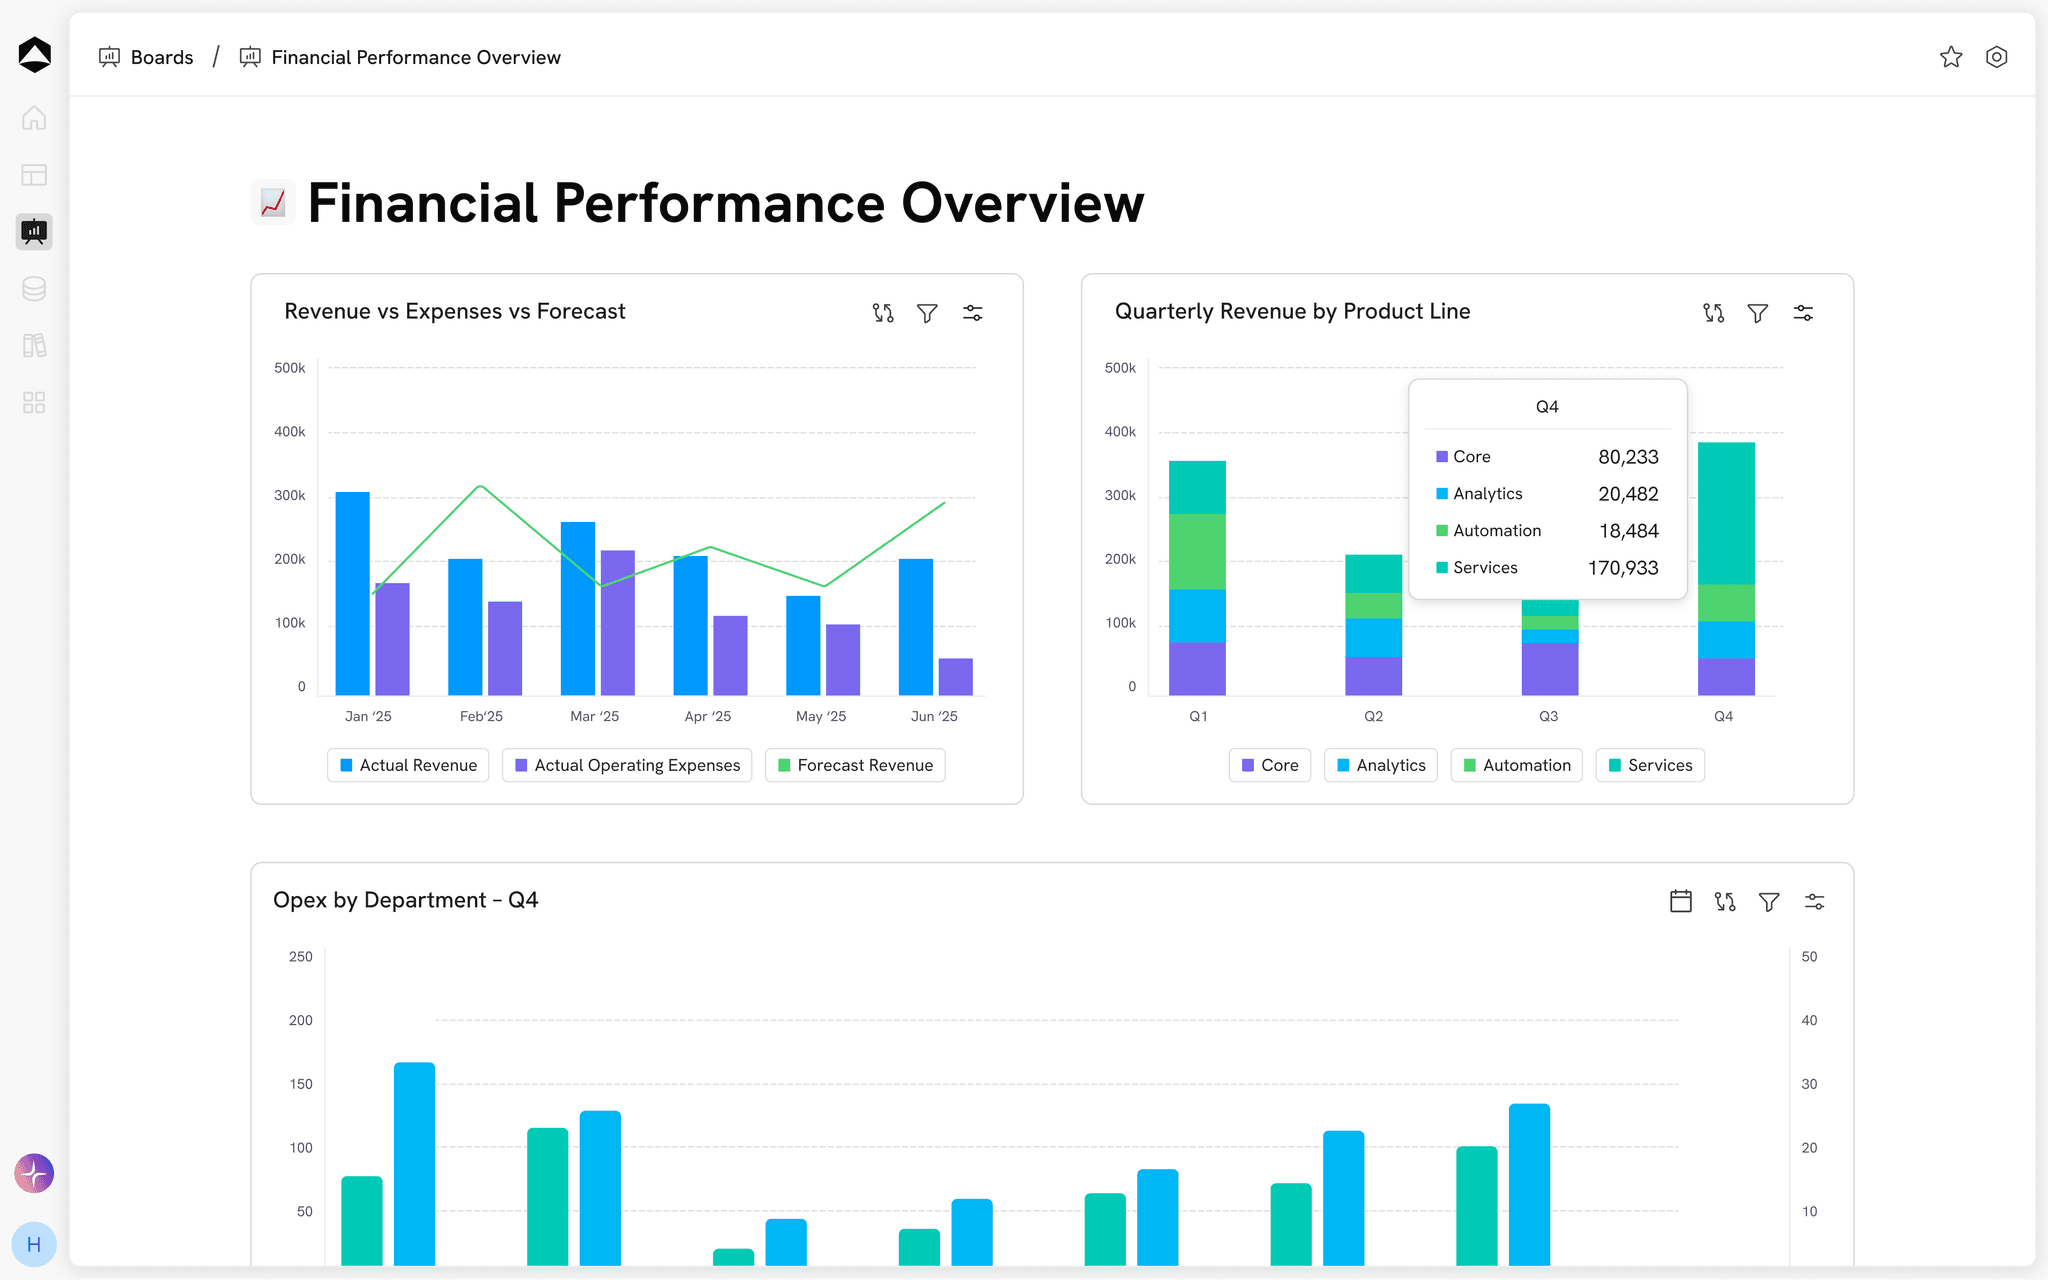
The decision behind the work
Turn the operating trade-off into a financial conversation.
For S&OP, operations, and finance.
Agree the demand period
Keep commercial demand and available supply on the same product-family horizon.
Cost the capacity choice
Compare recovered demand contribution with the incremental shift cost.
Review the surplus
Treat output above demand as inventory investment, not additional sold revenue.
From context to the next move
Put the plan to work.
Keep the inputs, model and review connected around the work in front of you.
Connected inputs
Align demand assumptions
Bring sales, operations, and finance into the same period and product view.
Explore connected data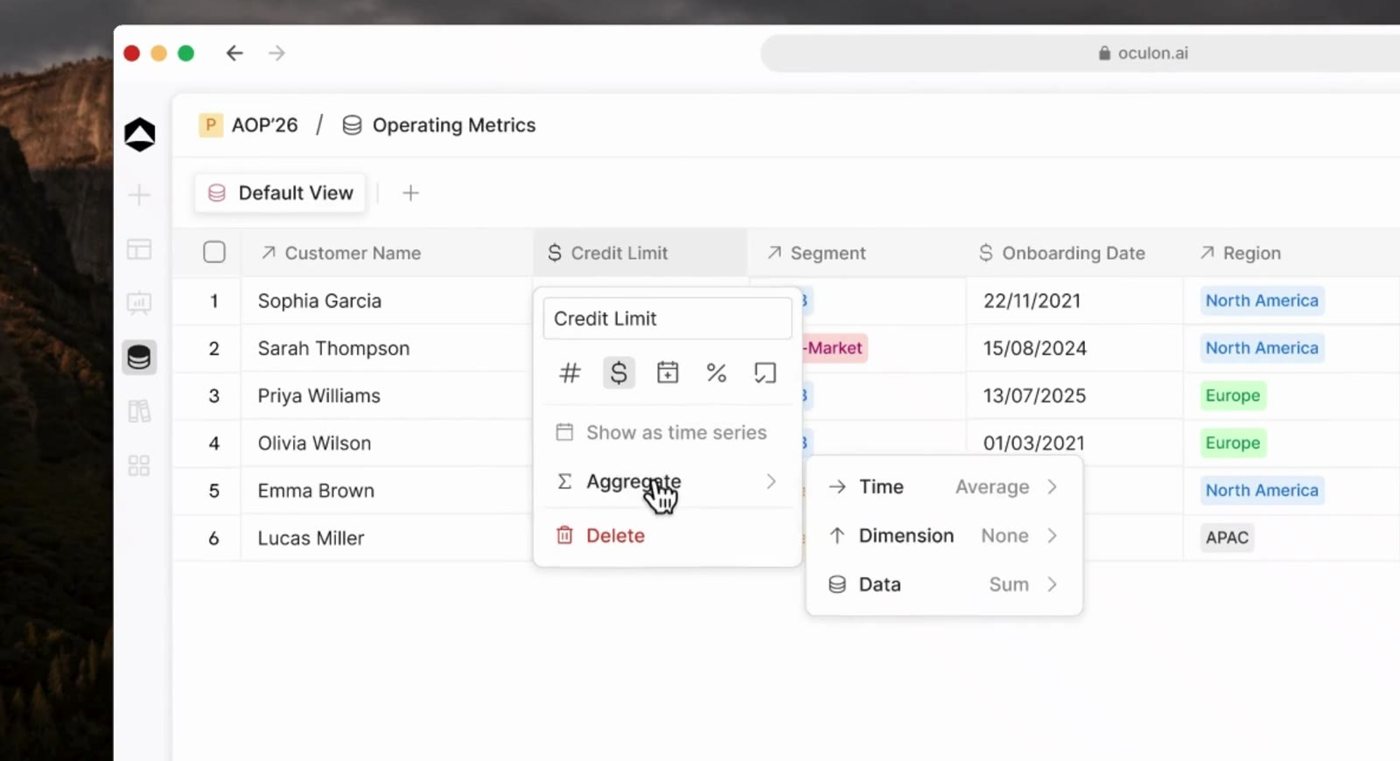
Business drivers
Make constraints visible
Model supply, lead times, and capacity alongside the demand plan.
Explore financial models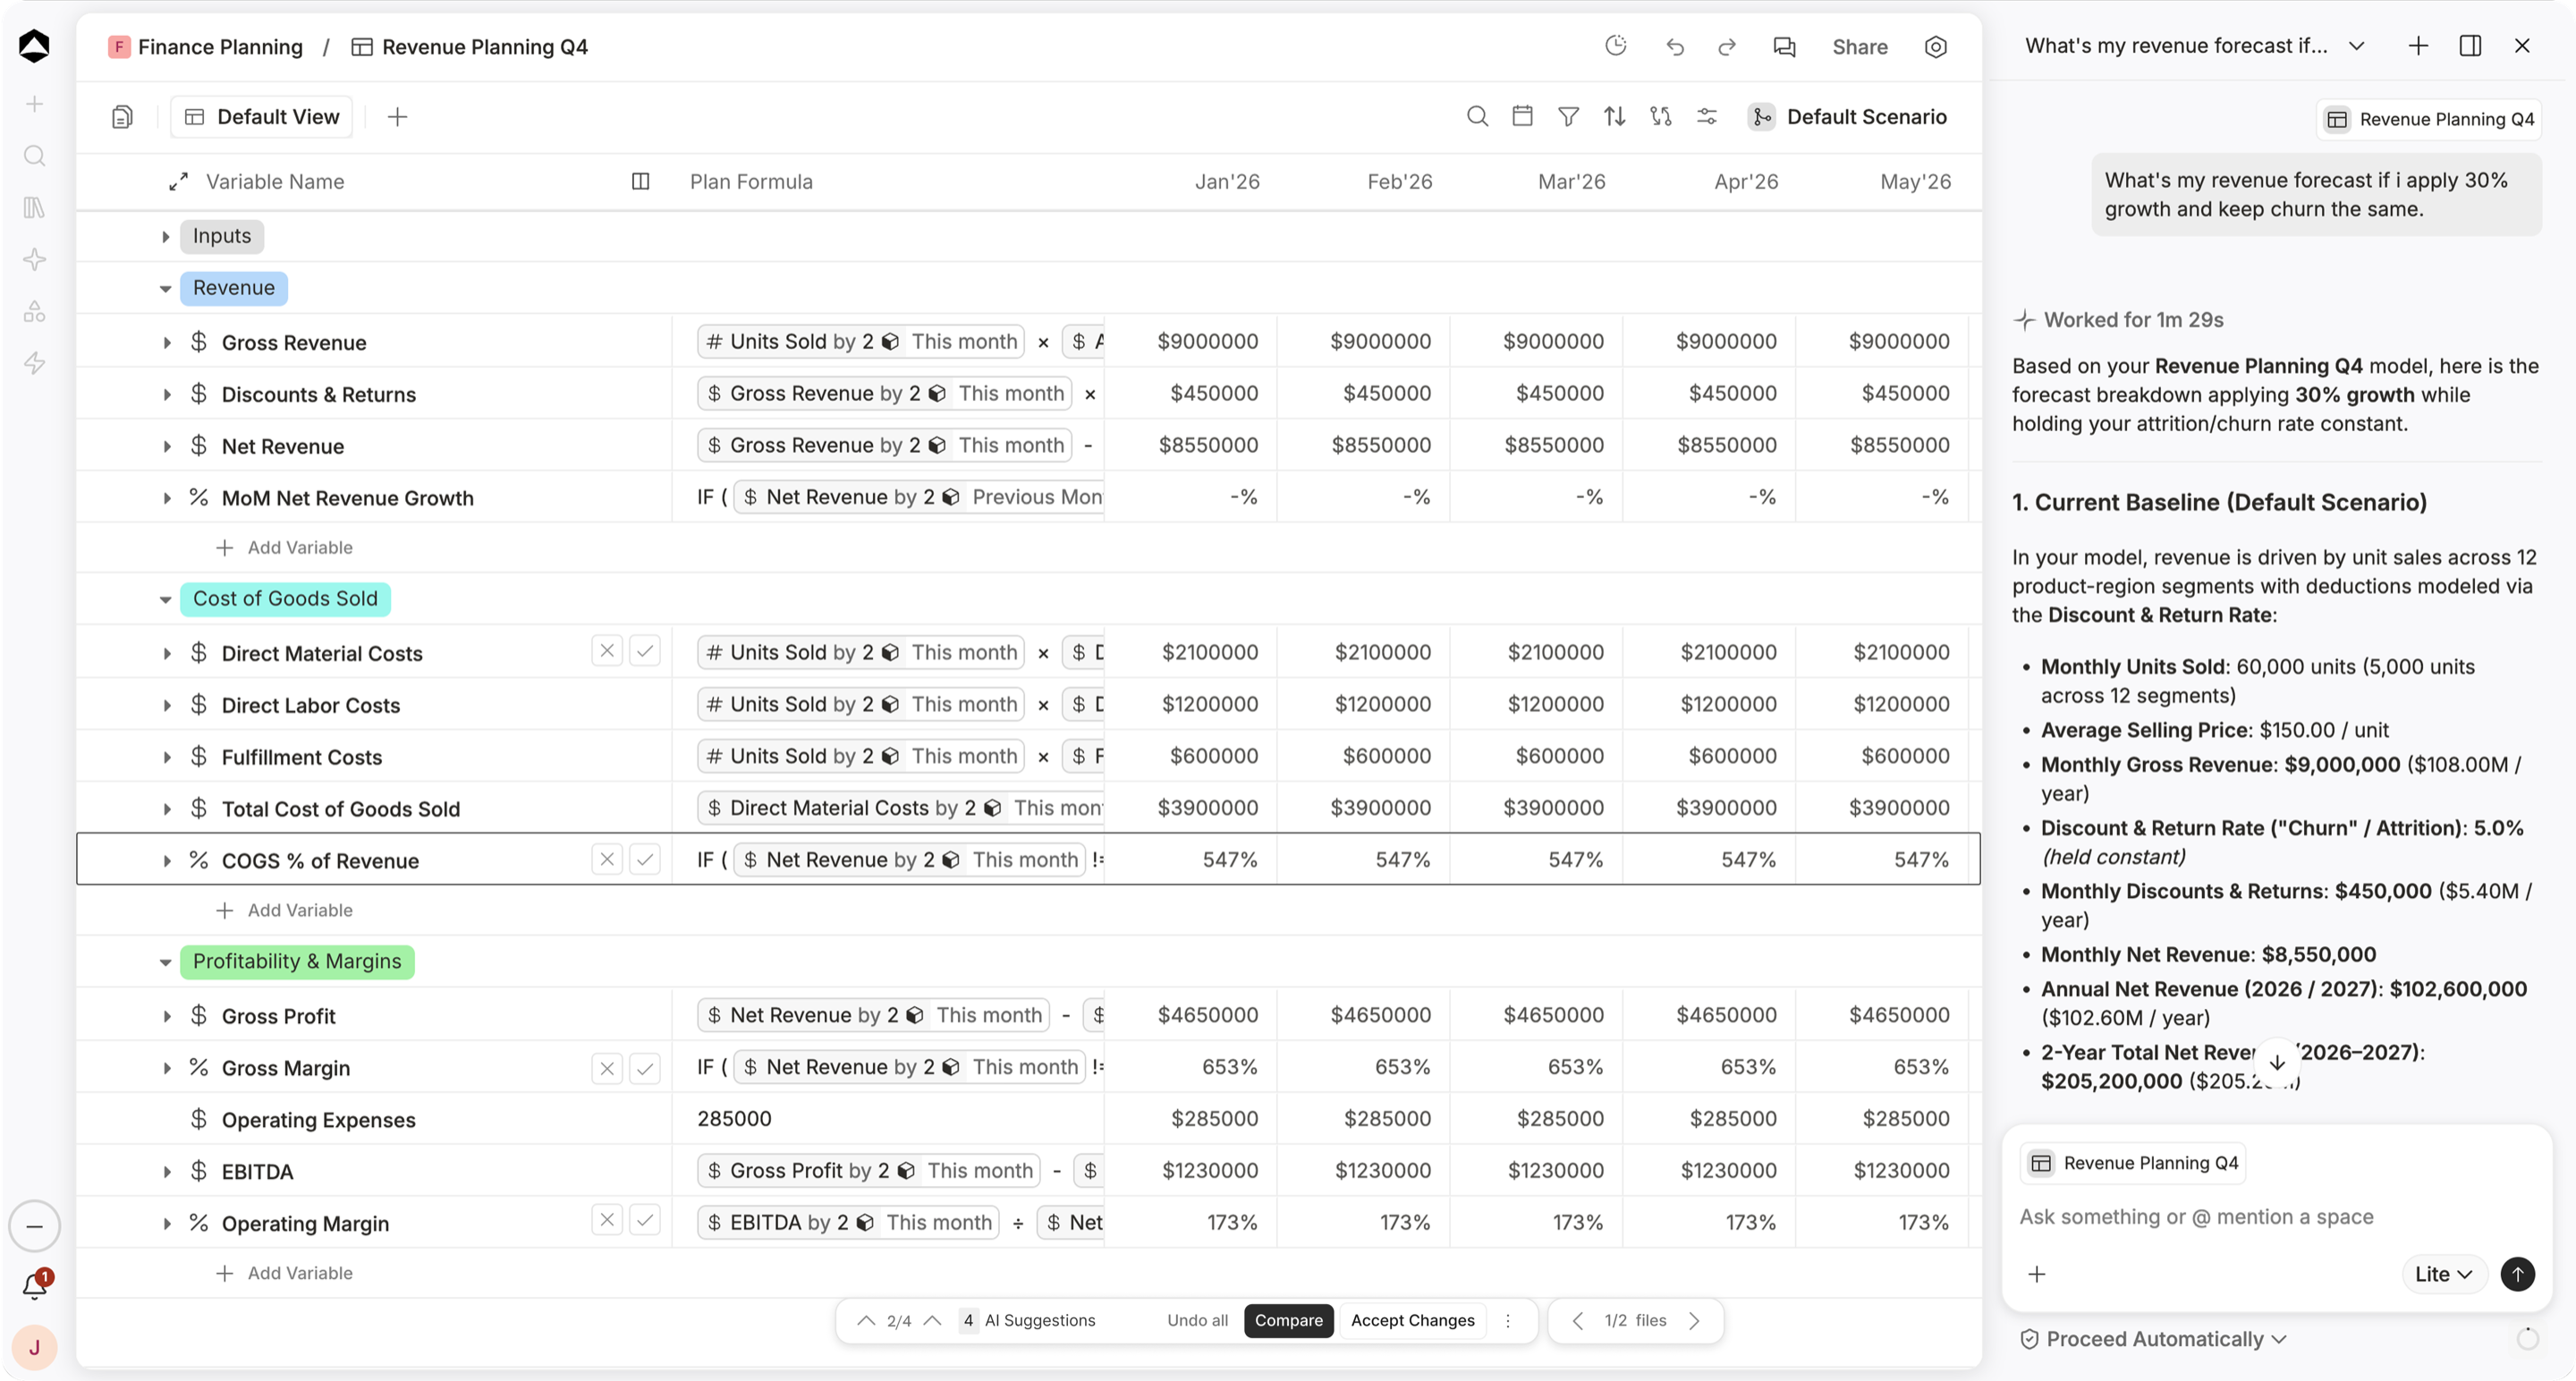
Planning choices
Connect margin and cash
Review how an operating alternative changes cost and inventory commitments.
Explore scenarios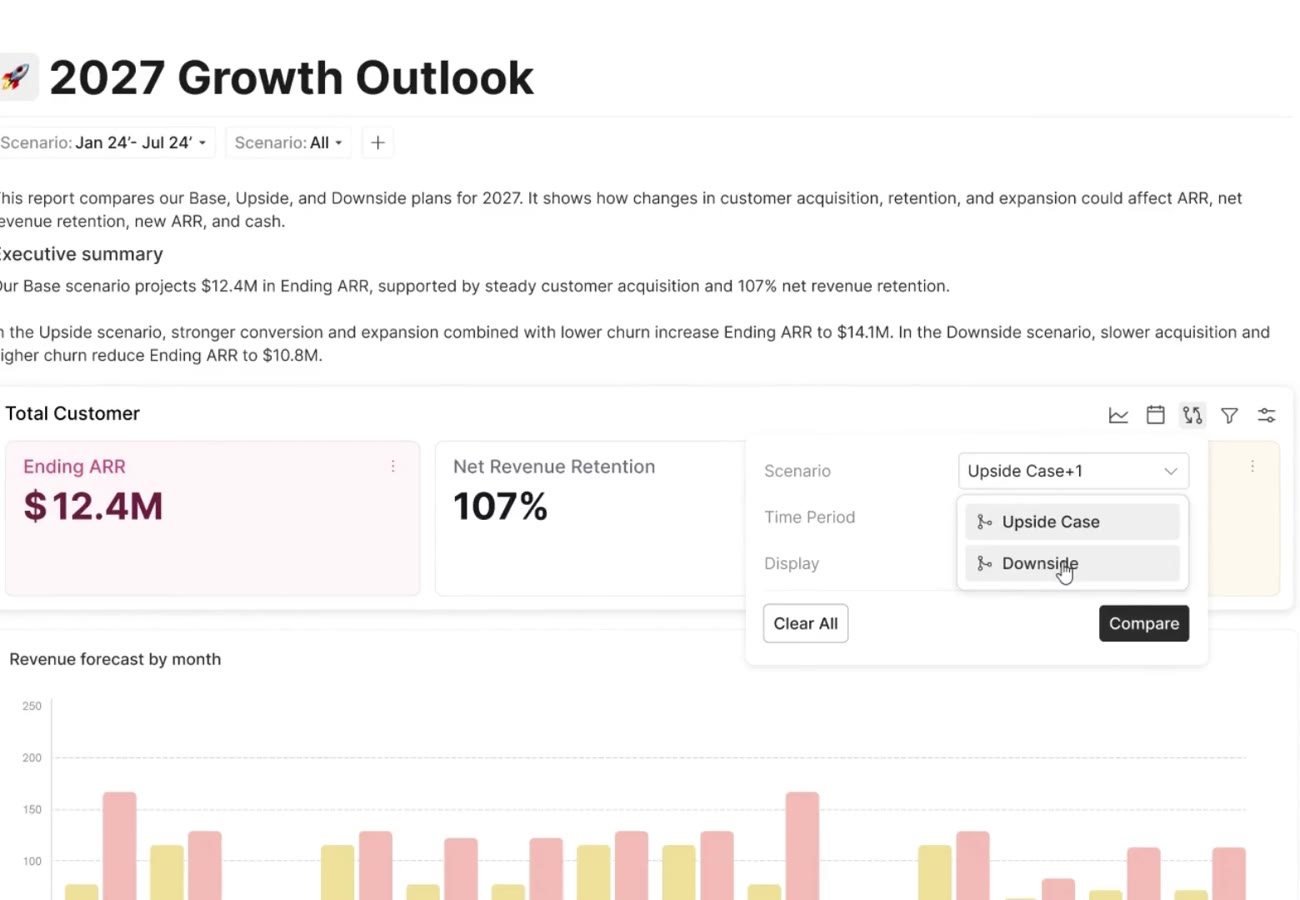
Shared review
Review the surplus
Compare the $3K incremental contribution with $4K tied up in surplus stock, then review service priorities and the shift commitment.
Explore shared boards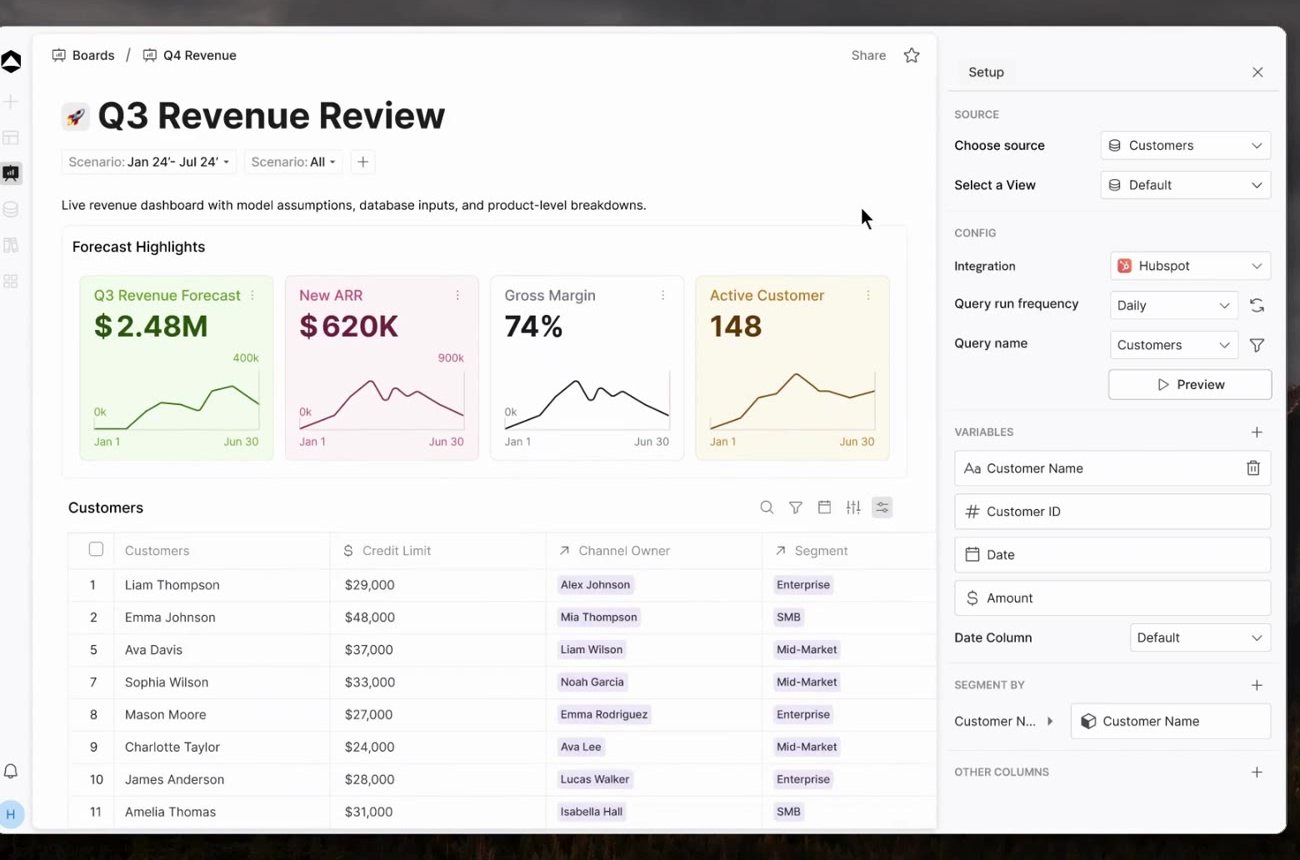
One connected financial picture
Is closing a 600-unit supply gap worth the extra shift?
Compare the $3K incremental contribution with $4K tied up in surplus stock, then review service priorities and the shift commitment.
Explore the s&op review example
Supply balance = available supply − demand. The economic illustration assumes $25 contribution per recovered unit and $12K extra-shift cost.
October 2026 · operating period · Illustrative dataEXPLORE THE DECISION
Is closing a 600-unit supply gap worth the extra shift?
Demand and available supply
Thousands of unitsInspect the model inputs3 model lines
| Product family | Demand | Supply | Balance |
|---|---|---|---|
| 6,000 | 5,700 | −300 | |
| 4,000 | 3,800 | −200 | |
| 2,400 | 2,300 | −100 |
Scroll to inspect all columns
The $20 cost of each surplus unit is an illustrative stock-investment assumption. Supplier constraints, service targets, and collection timing require review.
A little more context
Questions about Supply Chain & S&OP Planning.
Does this replace our operational execution systems?
The solution brings operating assumptions into financial planning and review. Existing operational systems can remain the source of orders, inventory, and execution records. Discuss your data and planning needs with the Oculon team.
Is this an operational scheduling system?
The example is a financial planning comparison. Order execution, detailed scheduling, supplier records, and inventory transactions remain operational-system inputs to discuss for your workflow.
What should we agree before comparing plans?
Supply balance = available supply − demand. The economic illustration assumes $25 contribution per recovered unit and $12K extra-shift cost.
Where can we find a starting model?
Explore templates for planning, revenue, cash, headcount and reporting. Adapt the assumptions and structure to your business, and agree access with the people who will review the work.
Explore templates