Industries · Oculon for AI-native Companies
AI-native CompaniesGrow usage with the economics in view.
Usage can grow faster than contribution. Connect realized pricing, model mix, and inference cost before deciding what growth can fund.
The business behind the numbers
Put usage and cost on the same curve.
For AI-native finance and product teams.
Use one workload denominator
Keep token volume and realized revenue on the same unit basis as inference cost.
Expose the model assumption
Review the blended cost and the quality/latency trade-off instead of treating routing as a free margin improvement.
Keep contribution honest
Separate the inference comparison from the wider costs needed to run the business.
From context to the next move
Put the plan to work.
Keep the inputs, model and review connected around the work in front of you.
Connected inputs
Model the workload
Keep token volume, model mix, and usage segments visible.
Explore connected data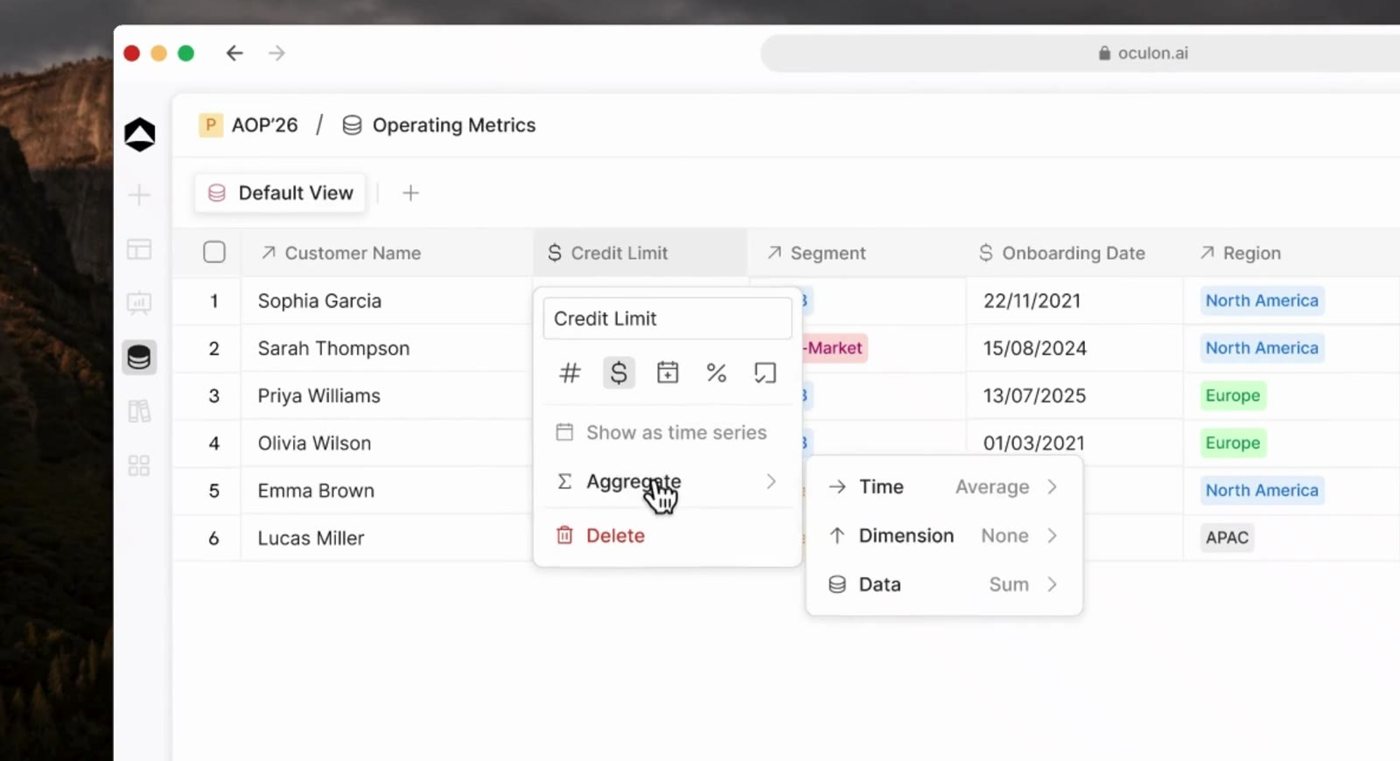
Business drivers
Review realized economics
Compare usage revenue with the cost of serving it.
Explore financial models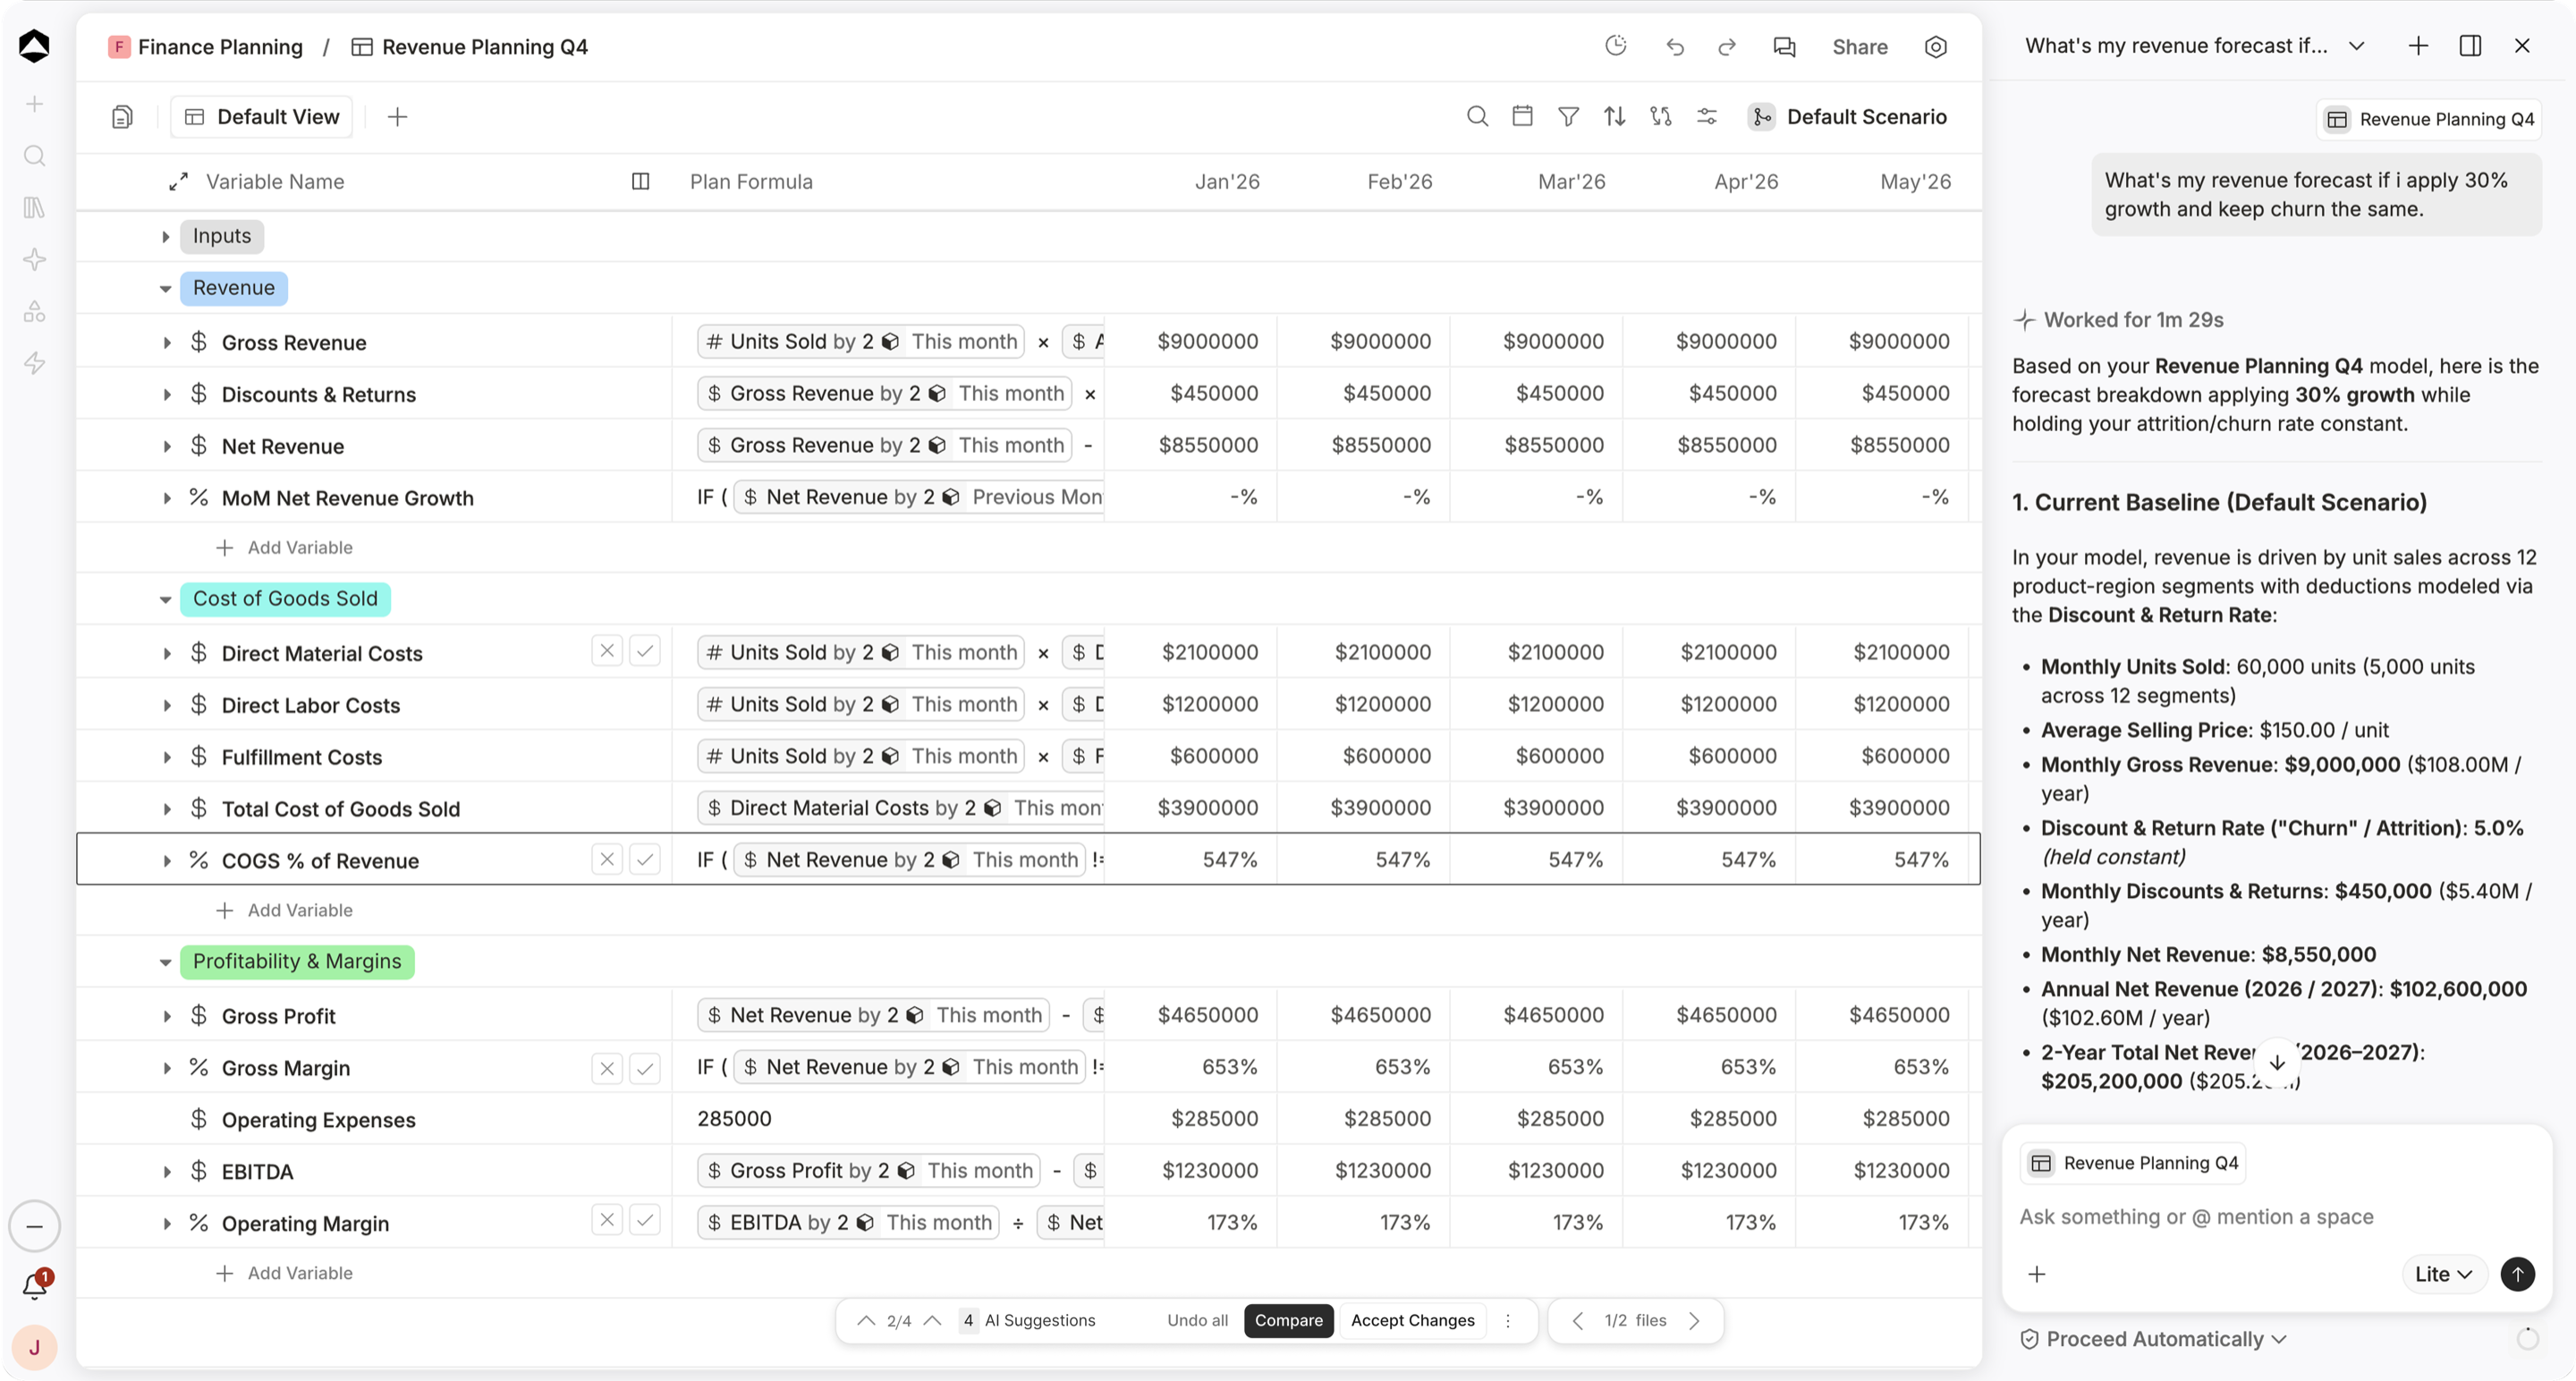
Planning choices
Connect investment and cash
Bring infrastructure and hiring assumptions into the wider outlook.
Explore scenariosShared review
Keep contribution honest
Review quality, latency, and the full delivery-cost scope before applying a different model mix to the financial plan.
Explore shared boards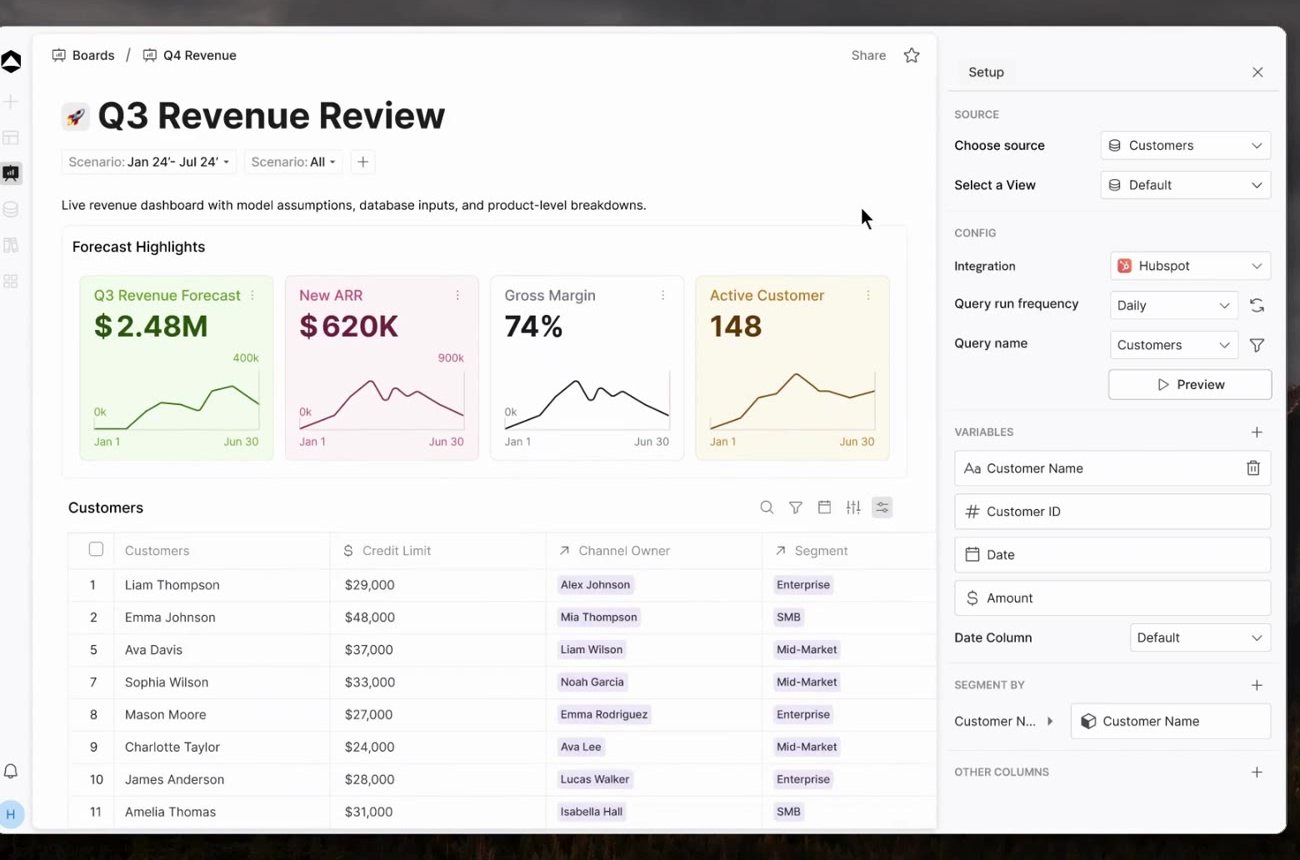
One connected financial picture
What is a lower inference cost worth at the same usage?
Review quality, latency, and the full delivery-cost scope before applying a different model mix to the financial plan.
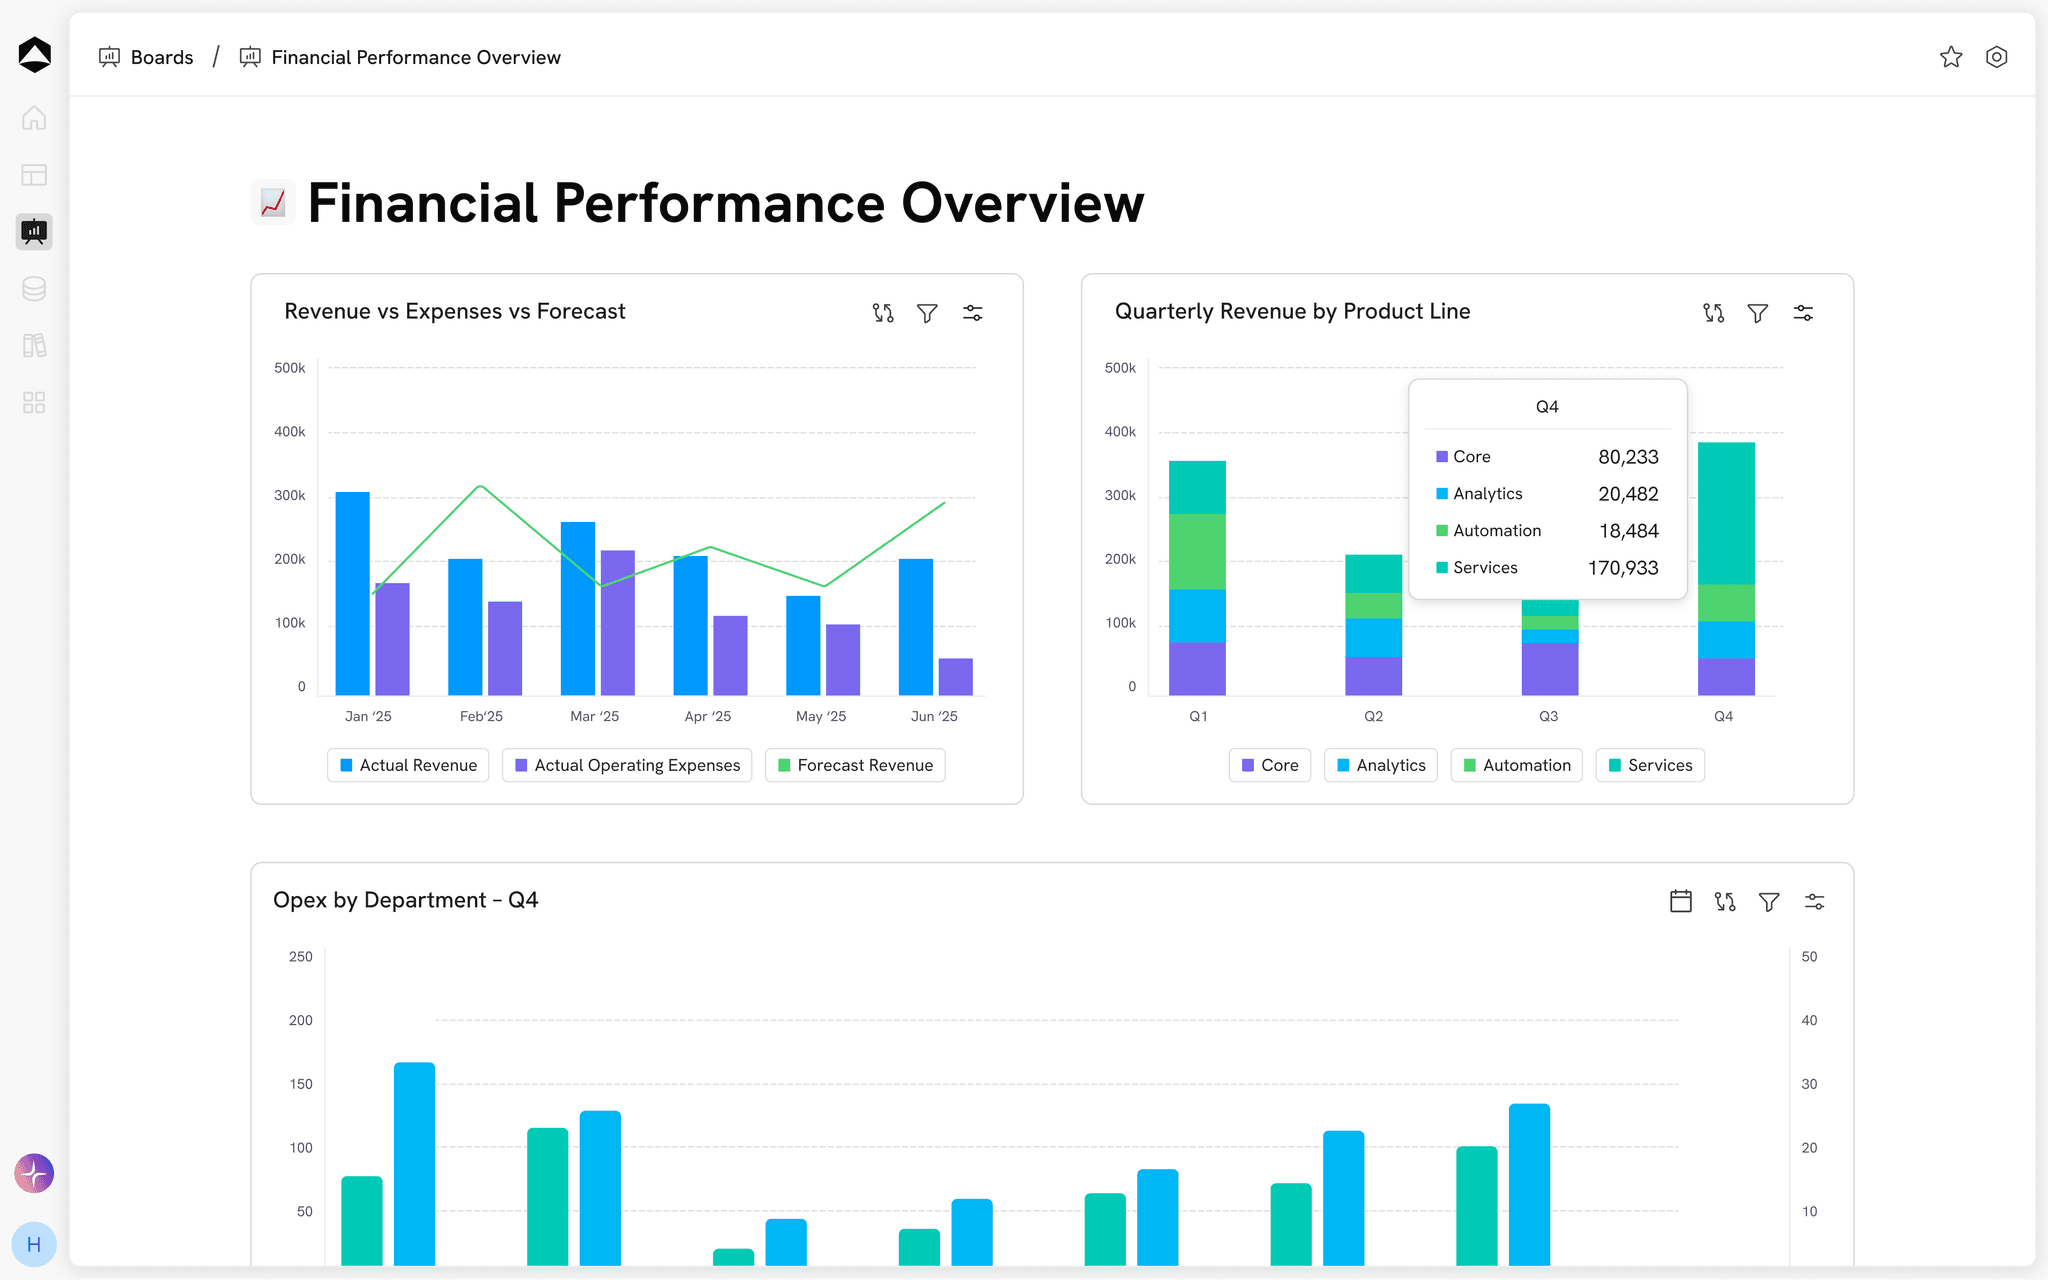
Explore the ai unit economics example
Usage revenue = token volume ÷ 1M × realized price. Contribution here = usage revenue − modeled inference spend.
October 2026 · 100M-token workload · Illustrative dataTHE ECONOMICS IN VIEW
What is a lower inference cost worth at the same usage?
Revenue and inference cost per 1M tokens
USD per 1M tokensPer 1M tokens · contribution before other delivery costs
Inspect the model inputs3 model lines
| Cost driver | Base routing | Cost alternative | Context |
|---|---|---|---|
| $50 / 1M | $35 / 1M | Model mix | |
| $120 / 1M | $120 / 1M | Realized pricing | |
| $5,000 | $3,500 | 100M tokens |
Scroll to inspect all columns
Support, hosting, R&D, and other costs are excluded, so this is not gross margin. Cost changes are modeled assumptions, not automatic routing or provider switching.
A little more context
Questions about AI-native Companies.
Does the illustration show gross margin?
It shows contribution after inference costs only. Gross margin requires the full cost-of-revenue definition for your business. Keep hosting, support, and other applicable costs explicit in your model.
Is the contribution percentage the product’s gross margin?
No. This model subtracts inference spend only. Add the appropriate hosting, support, and other cost-of-revenue scope before discussing gross margin.
What should we agree before comparing plans?
Usage revenue = token volume ÷ 1M × realized price. Contribution here = usage revenue − modeled inference spend.
Where can we find a starting model?
Explore templates for planning, revenue, cash, headcount and reporting. Adapt the assumptions and structure to your business, and agree access with the people who will review the work.
Explore templates