Use cases · Oculon for KPI & Performance Reporting
KPI & Performance ReportingGive every target an explanation.
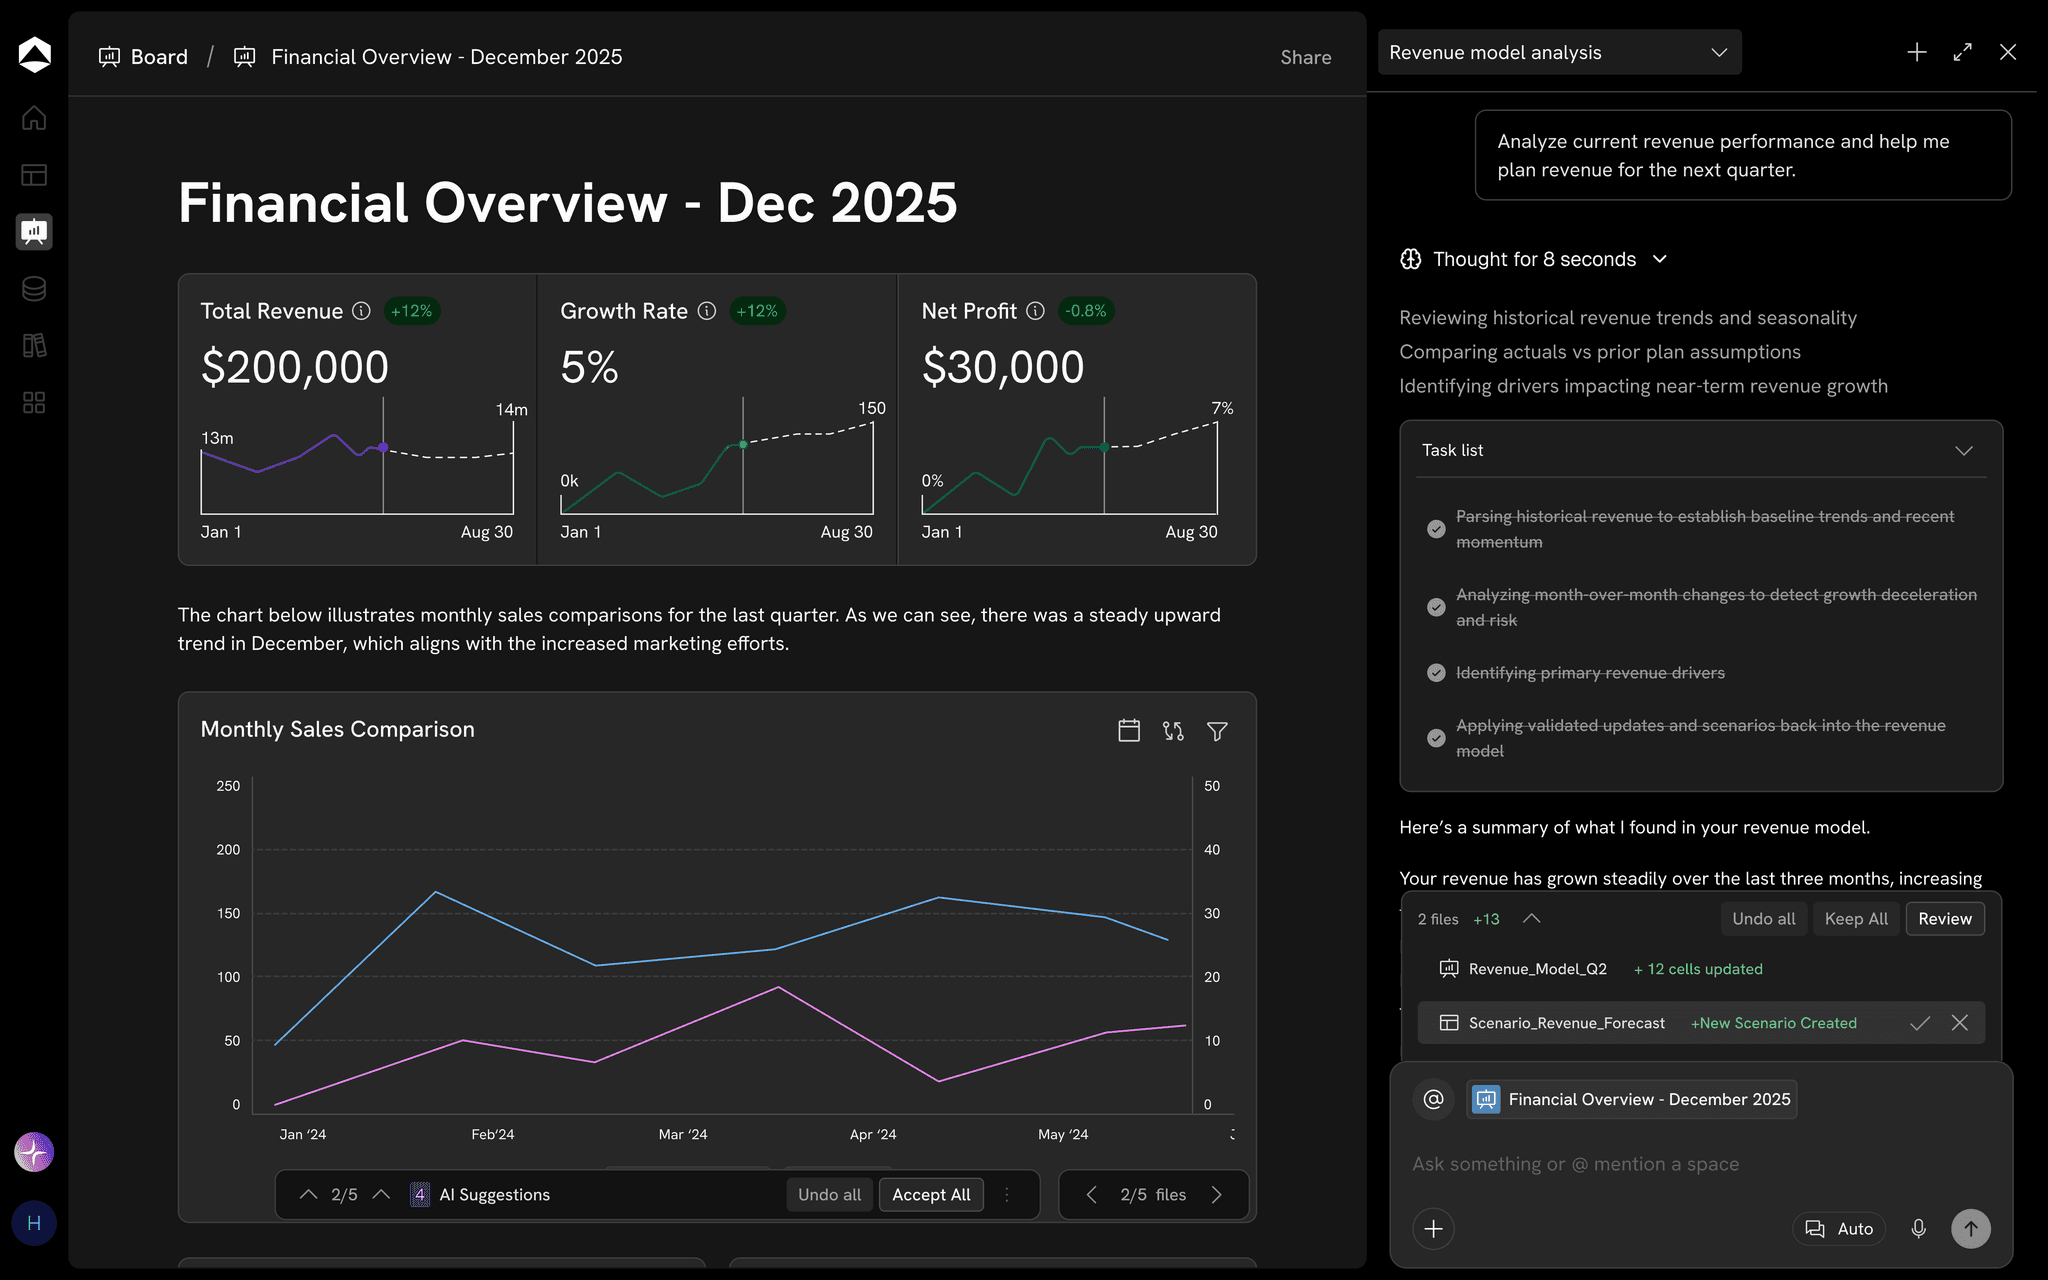
ARR can beat plan while retention trails it. Keep the metric definition, responsible owner, and next question beside the result.
The decision behind the work
A scorecard that starts the right conversations.
For Finance and operating leaders.
Define the measure
Show period, units, cohort, and included costs before judging the result.
Separate the drivers
Do not let one aggregate score hide retention, margin, or acquisition efficiency.
Take the right question to its owner
Bring the relevant underlying assumptions into the next review.
From context to the next move
Put the plan to work.
Keep the inputs, model and review connected around the work in front of you.
Connected inputs
Keep definitions shared
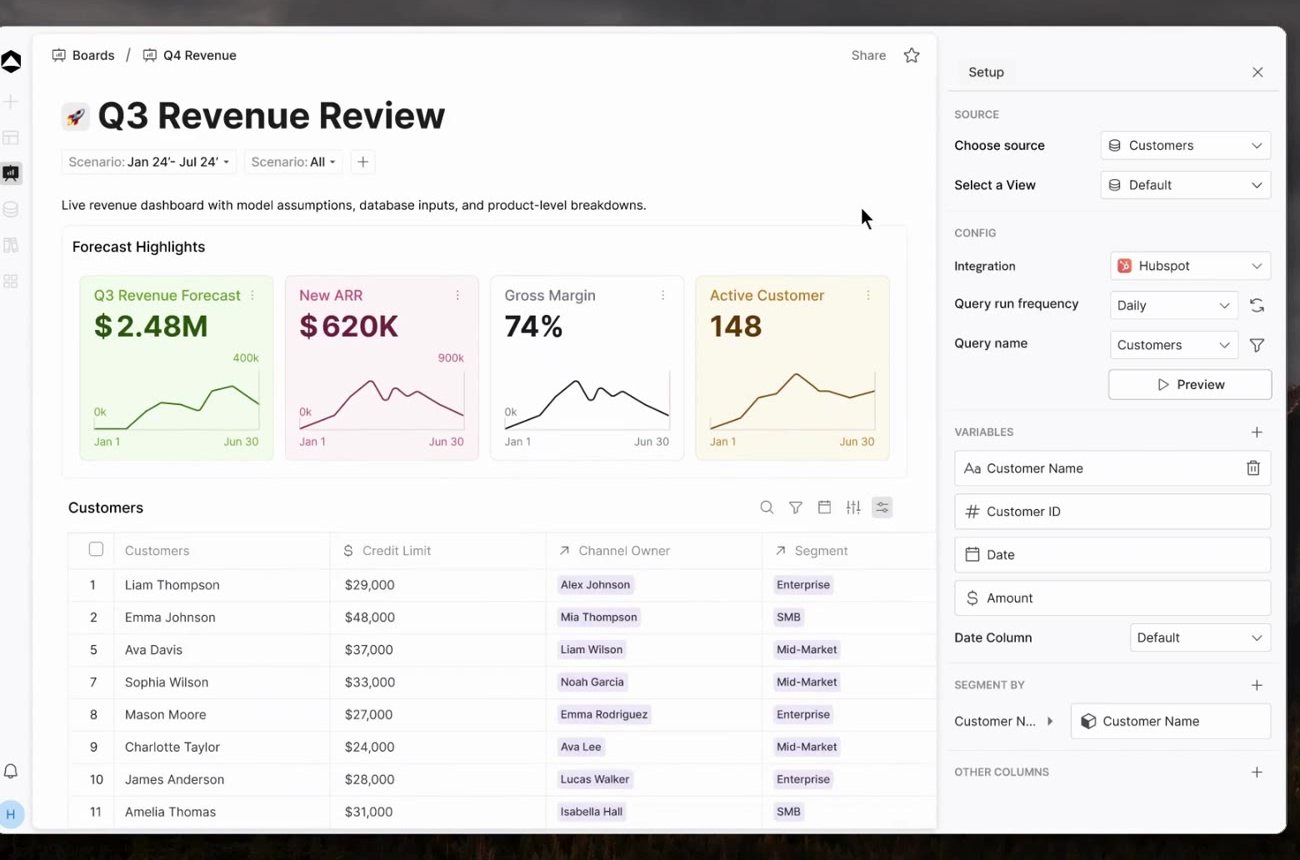
Agree the calculation, period, and dimensions behind each metric.
Explore connected data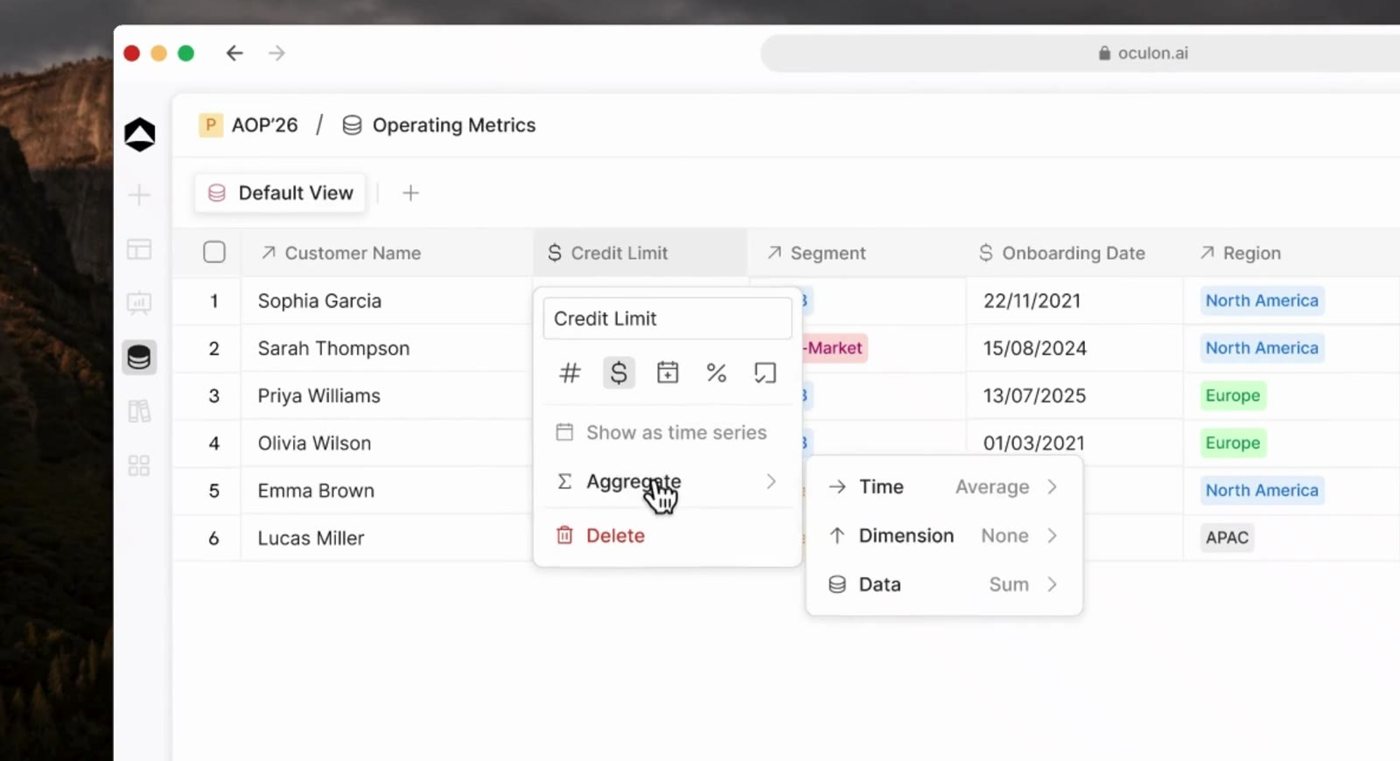
Business drivers
Put targets beside actuals
Review the direction and size of the gap in one performance view.
Explore financial models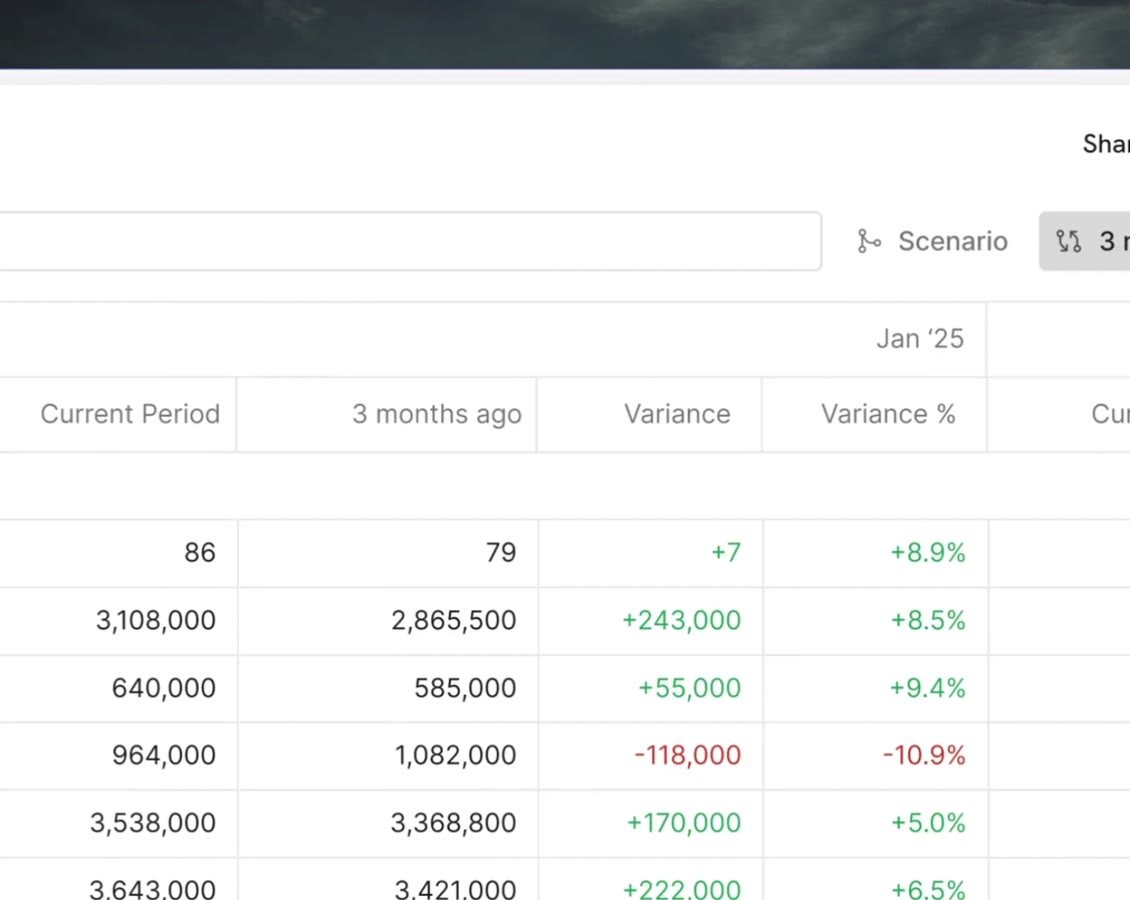
Planning choices
Give the next step an owner
Bring the operating team into the business drivers behind the score.
Explore scenarios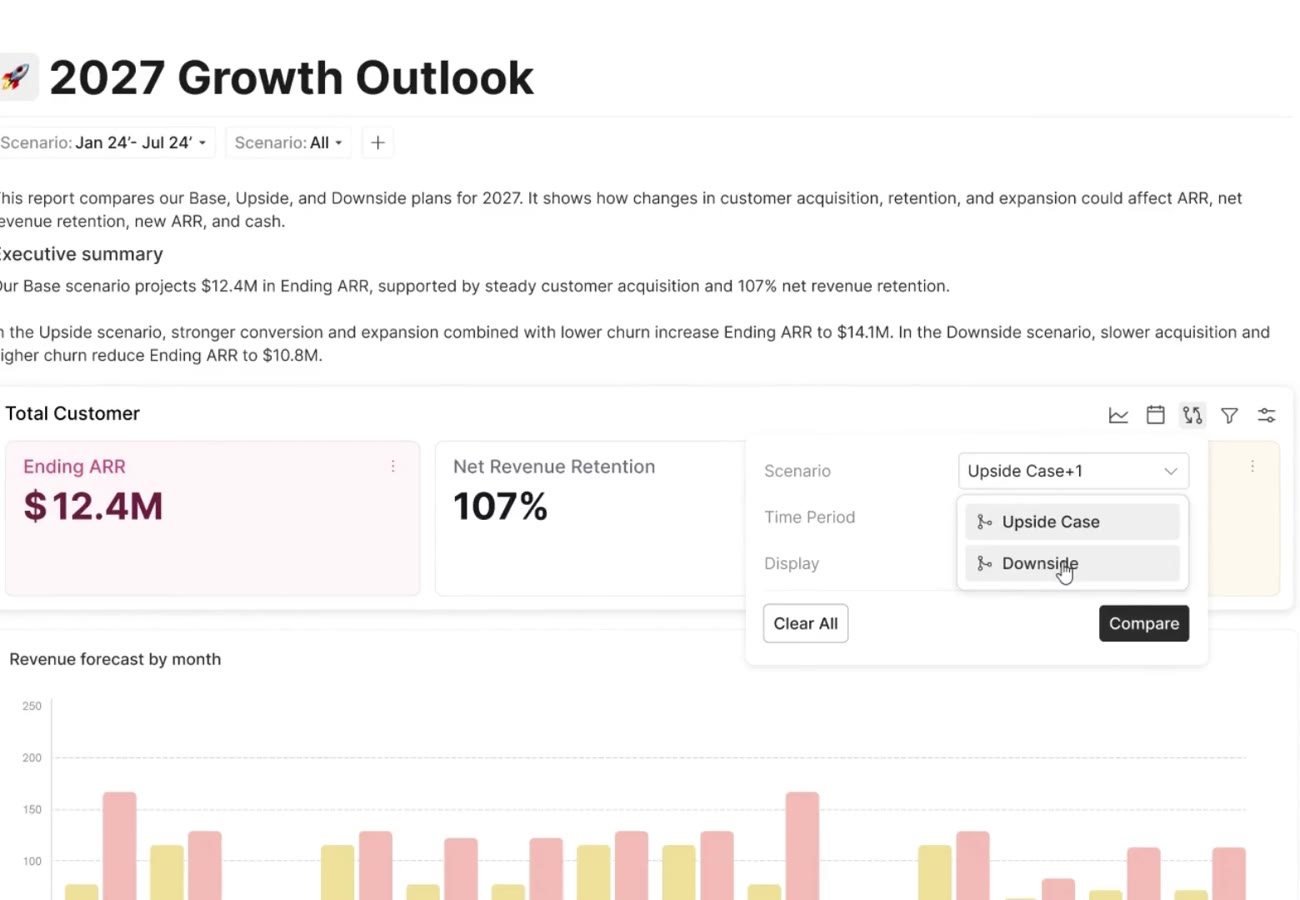
Shared review
Take the right question to its owner
Review expansion and churn with customer success, or acquisition costs and payback with marketing, before changing the target.
Explore shared boards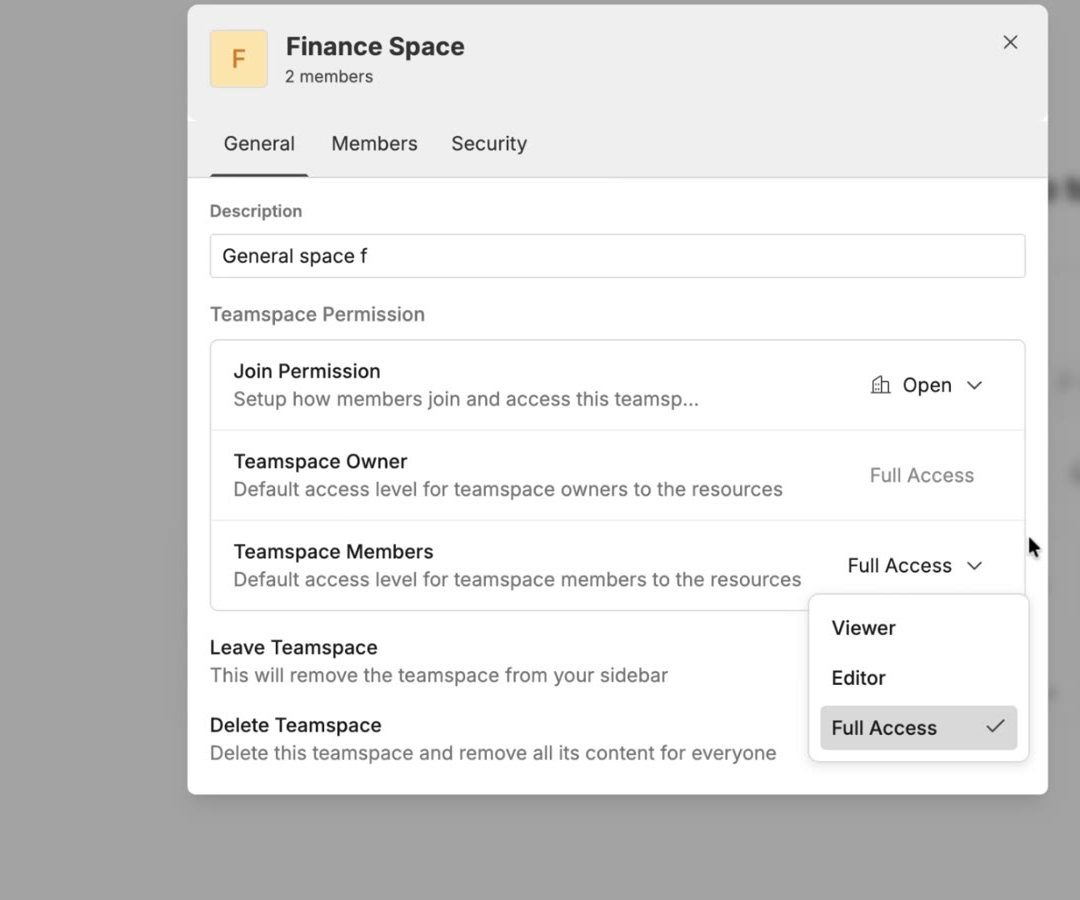
One connected financial picture
What is behind growth when retention misses its target?
Review expansion and churn with customer success, or acquisition costs and payback with marketing, before changing the target.
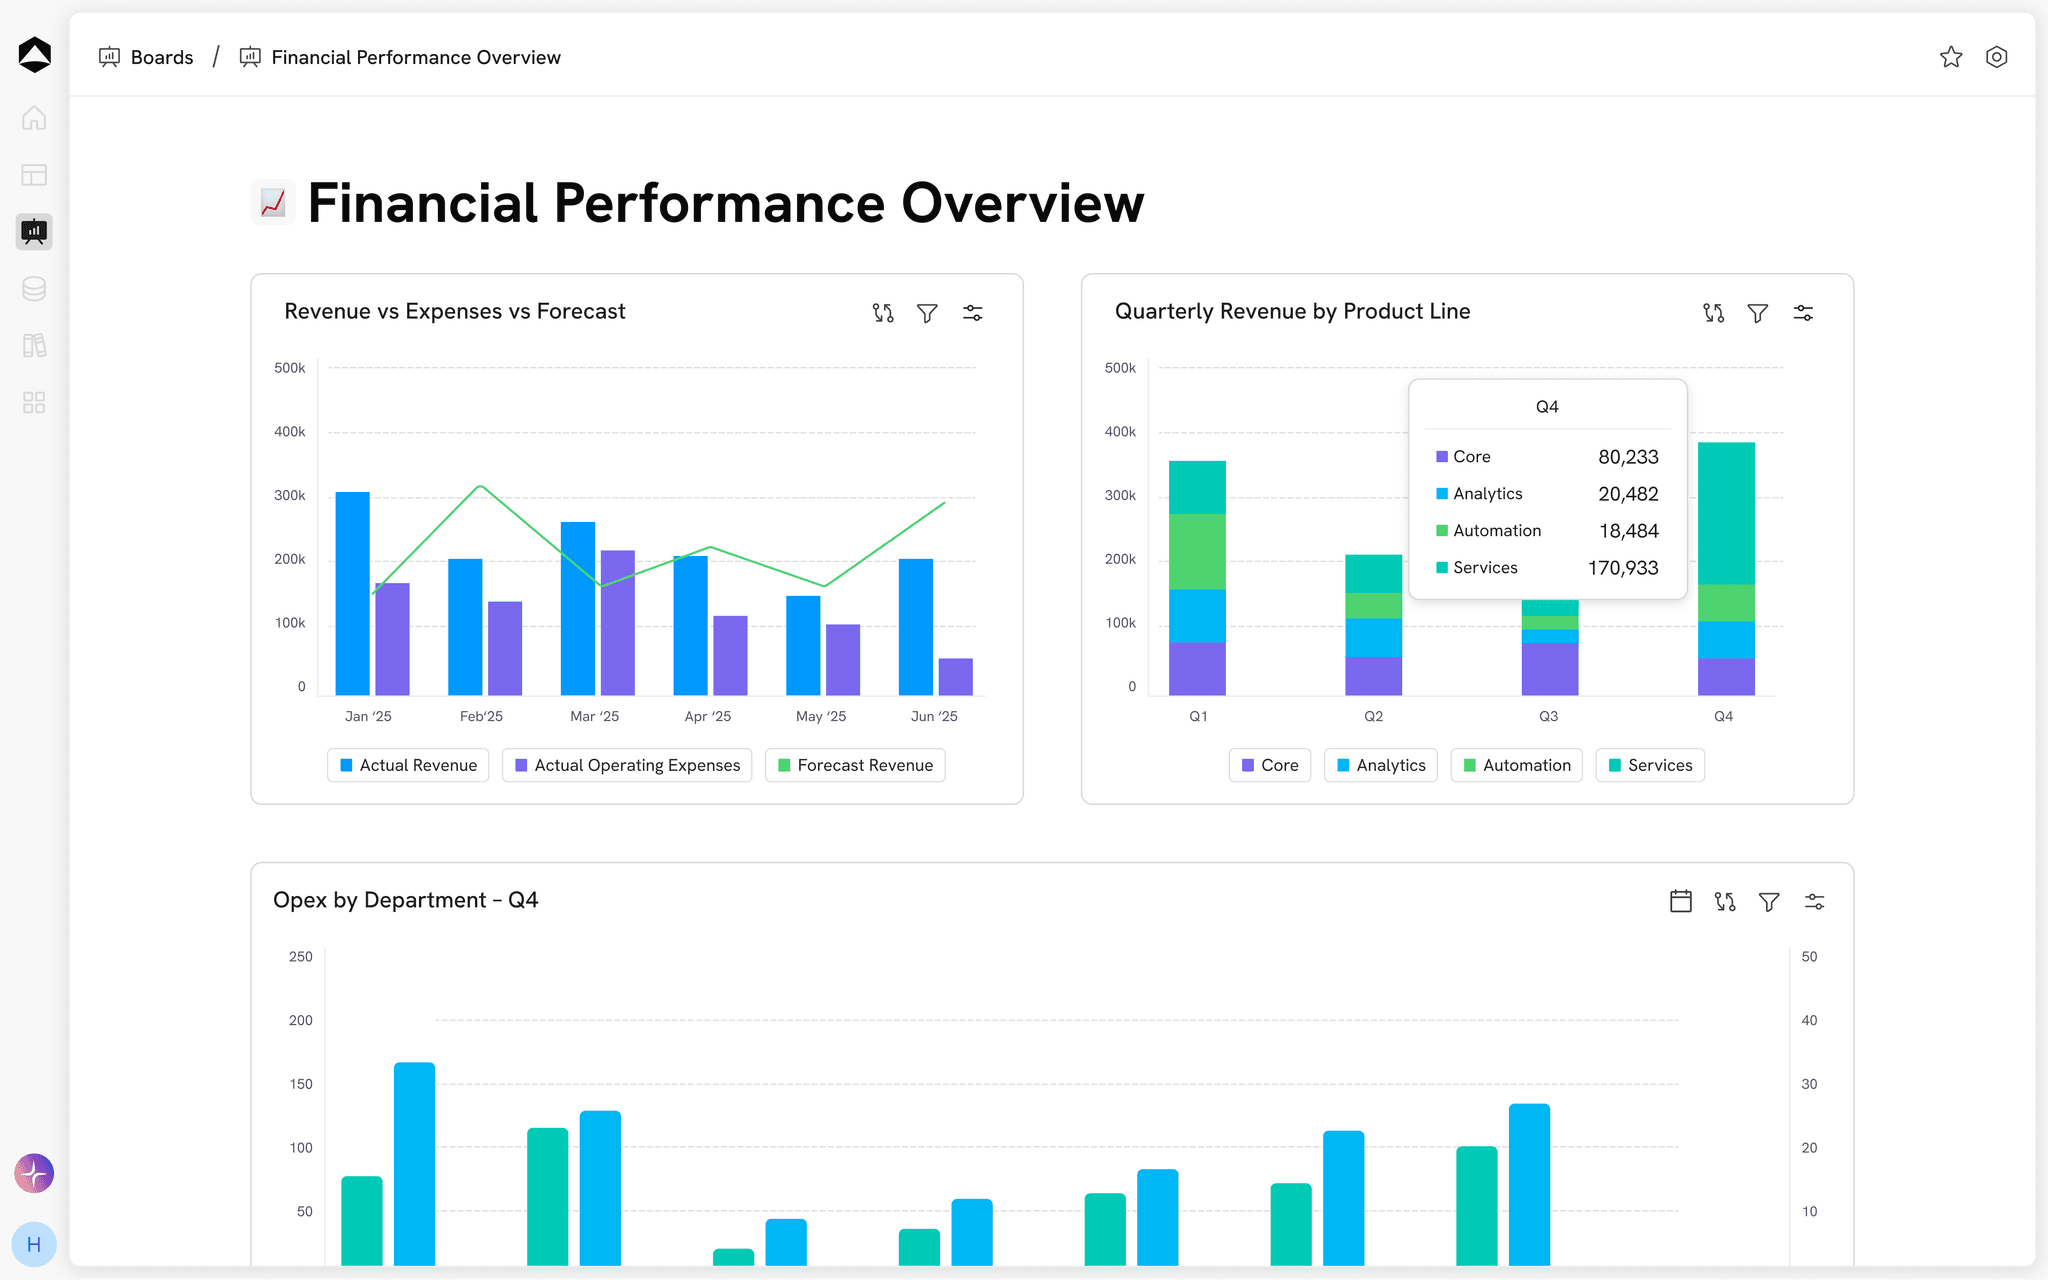
Explore the operating scorecard example
Each metric keeps its own definition and direction. ARR is a revenue run rate; NRR measures the opening cohort; a shorter CAC payback is preferable.
September 2026 · performance snapshot · Illustrative dataEXPLORE THE DECISION
What is behind growth when retention misses its target?
Performance against target
% of targetTarget $12.0M · Sales
Target 115% · Customer success
Target 3.0× · RevOps
Inspect the model inputs3 model lines
| Metric | Actual | Target | Owner |
|---|---|---|---|
| $12.4M | $12.0M | Sales | |
| 112% | 115% | Customer success | |
| 3.2× | 3.0× | RevOps |
Scroll to inspect all columns
Target comparisons are illustrative and do not create goals or submit owner actions. Keep acquisition cohorts and cost scope consistent for payback.
A little more context
Questions about KPI & Performance Reporting.
Can we use operational metrics alongside financial metrics?
Yes. Boards can bring financial performance and operating metrics into one reporting view. Dimensions and shared definitions keep the scope of each metric clear.
Should every metric use the same direction of progress?
No. Higher ARR or margin may be desirable, while fewer months of CAC payback is preferable. This example uses the metric direction for target achievement and preserves the actual and target values.
What should we agree before comparing plans?
Each metric keeps its own definition and direction. ARR is a revenue run rate; NRR measures the opening cohort; a shorter CAC payback is preferable.
Where can we find a starting model?
Explore templates for planning, revenue, cash, headcount and reporting. Adapt the assumptions and structure to your business, and agree access with the people who will review the work.
Explore templates