Use cases · Oculon for Inventory & Cost Planning
Inventory & Cost PlanningFree up stock cash without hiding the risk.
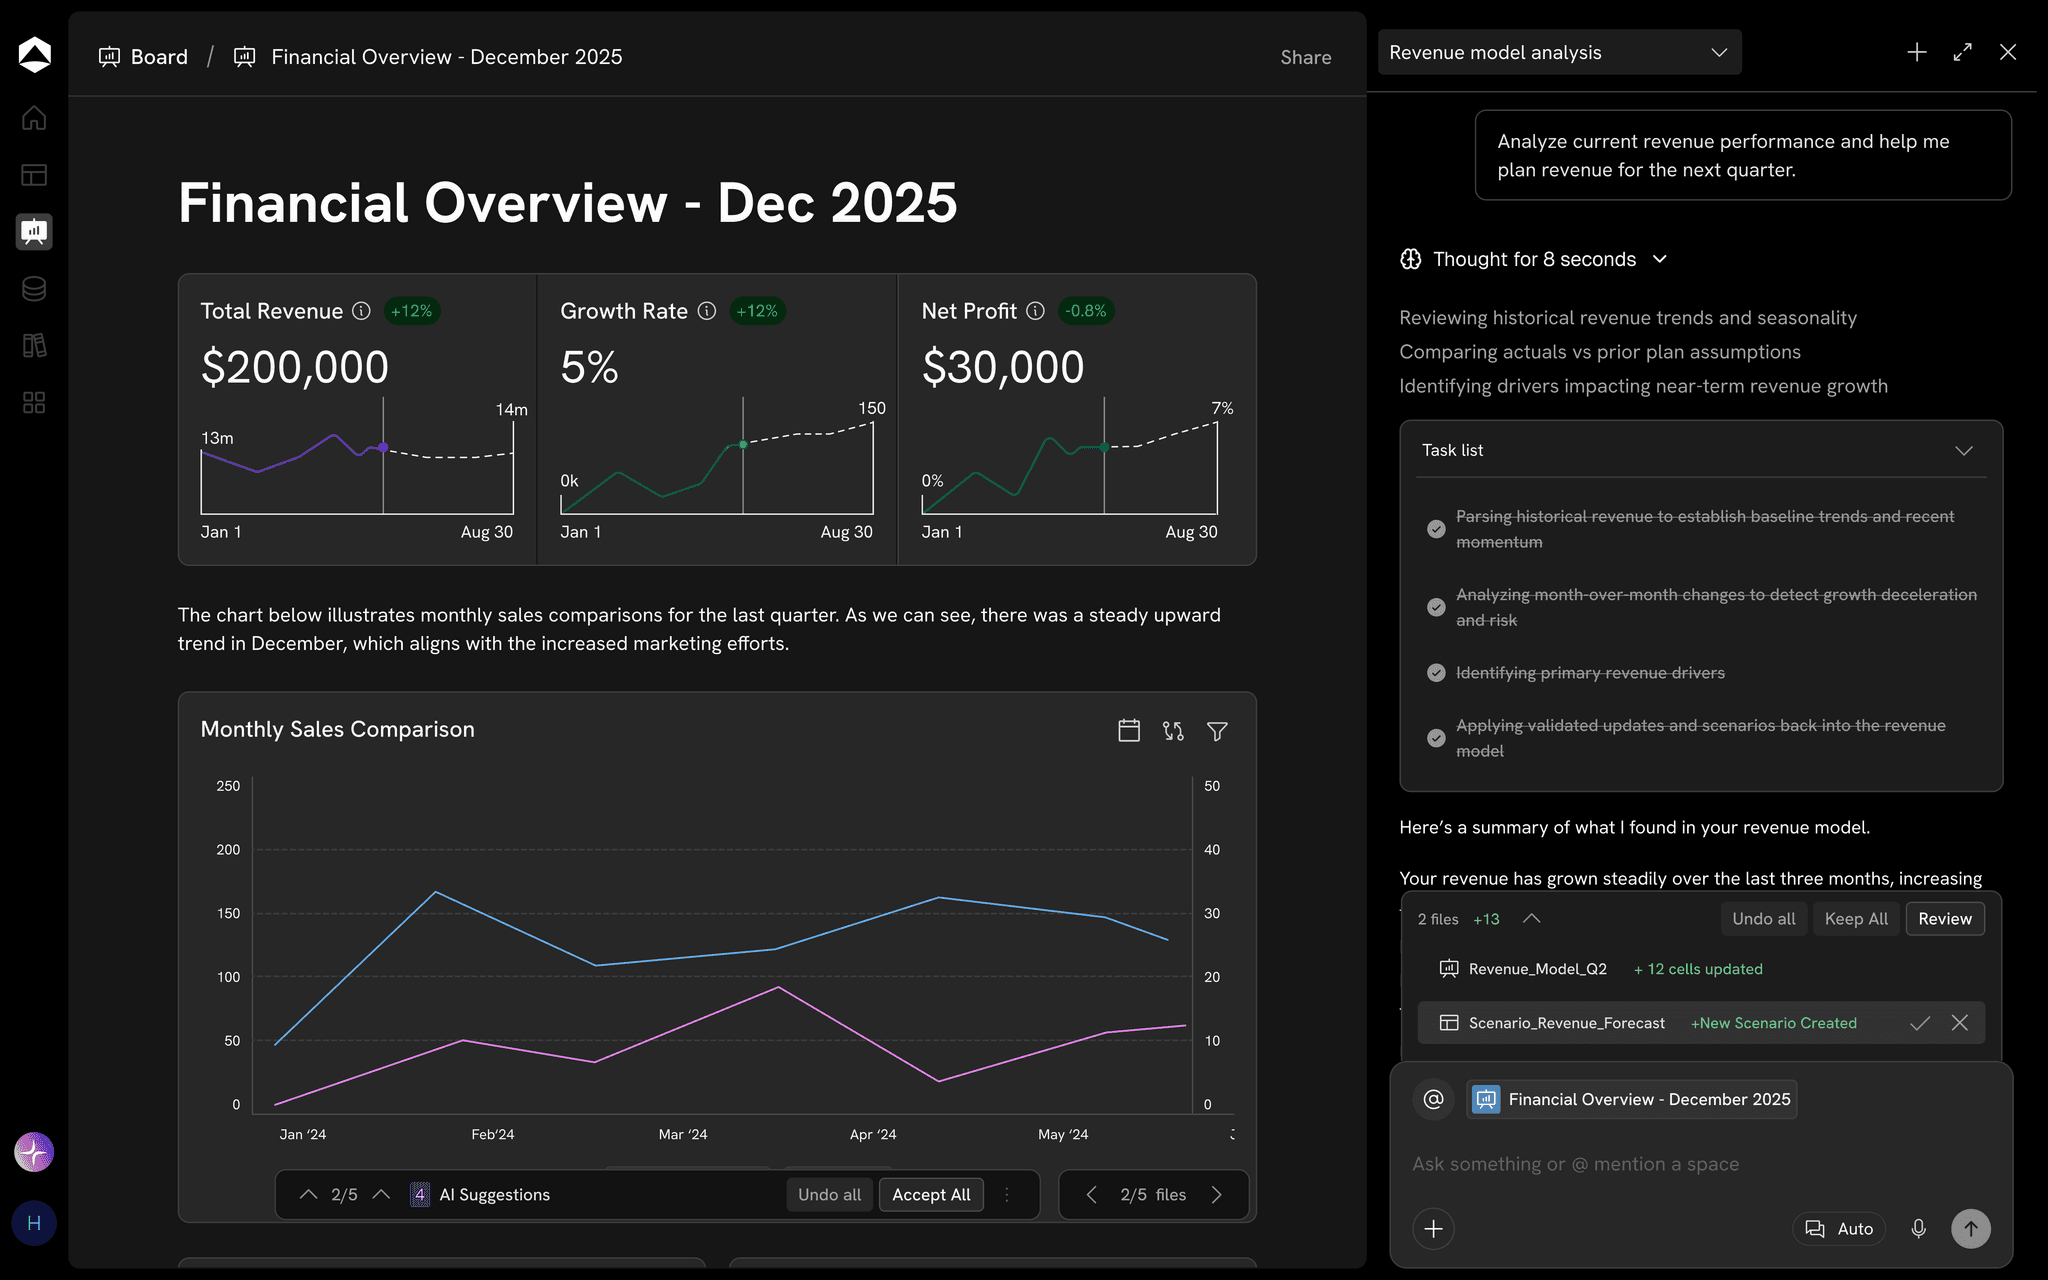
A lower inventory target releases working capital. Review where the cover changes and what replenishment needs to support it.
The decision behind the work
Make the stock plan part of the business plan.
For Finance and inventory planners.
Review by product
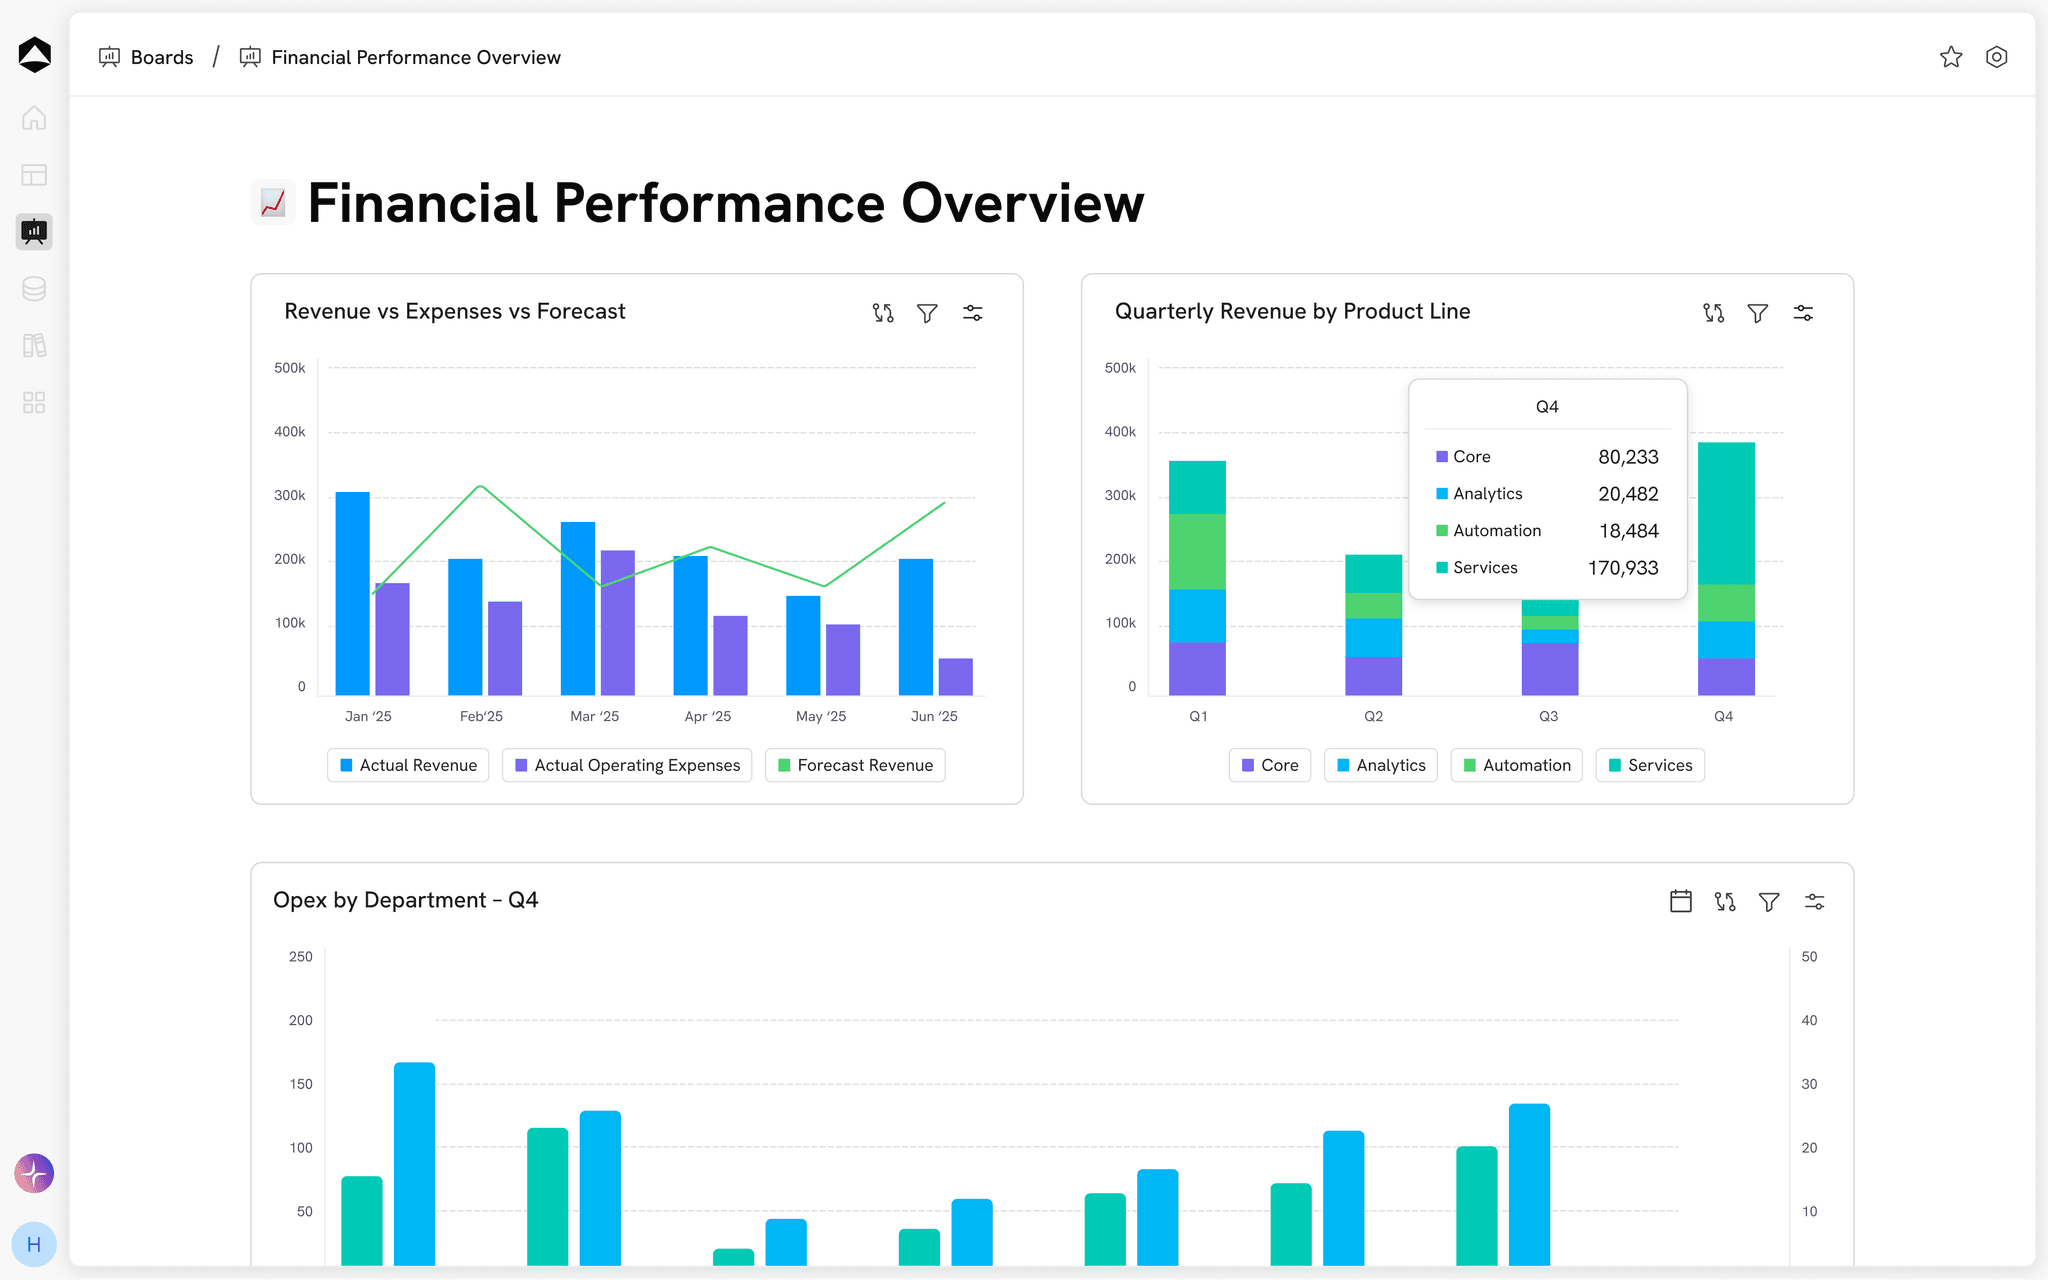
Separate core replenishment from seasonal exposure instead of applying one cover target to the range.
Keep valuation separate
Show stock at modeled unit cost and purchasing commitments as different cash exposures.
Test replenishment
Bring lead time and service assumptions into the discussion before lowering stock.
From context to the next move
Put the plan to work.
Keep the inputs, model and review connected around the work in front of you.
Connected inputs
Plan at the product level
Bring demand, cover, and purchasing into the dimensions that matter.
Explore connected data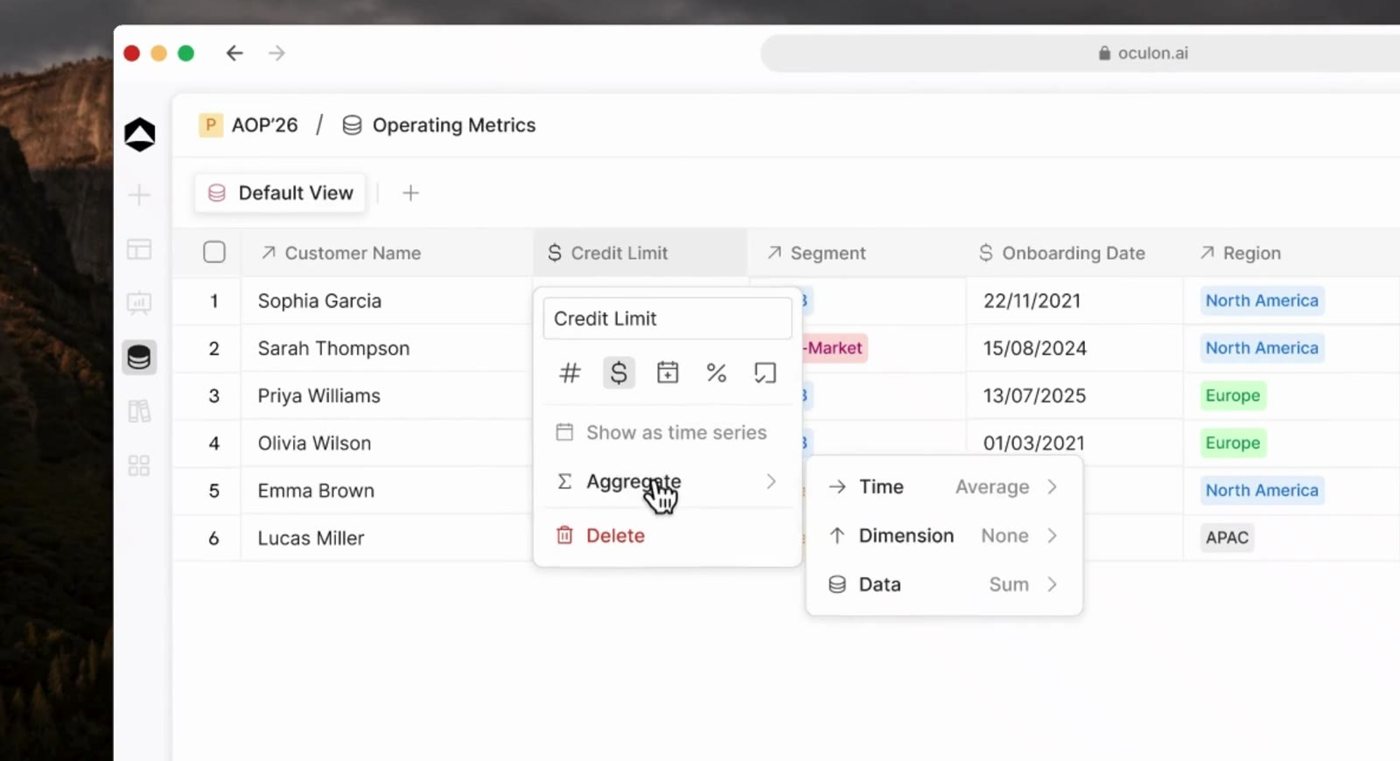
Business drivers
Understand landed cost
Review materials, freight, and other unit-cost assumptions together.
Explore financial models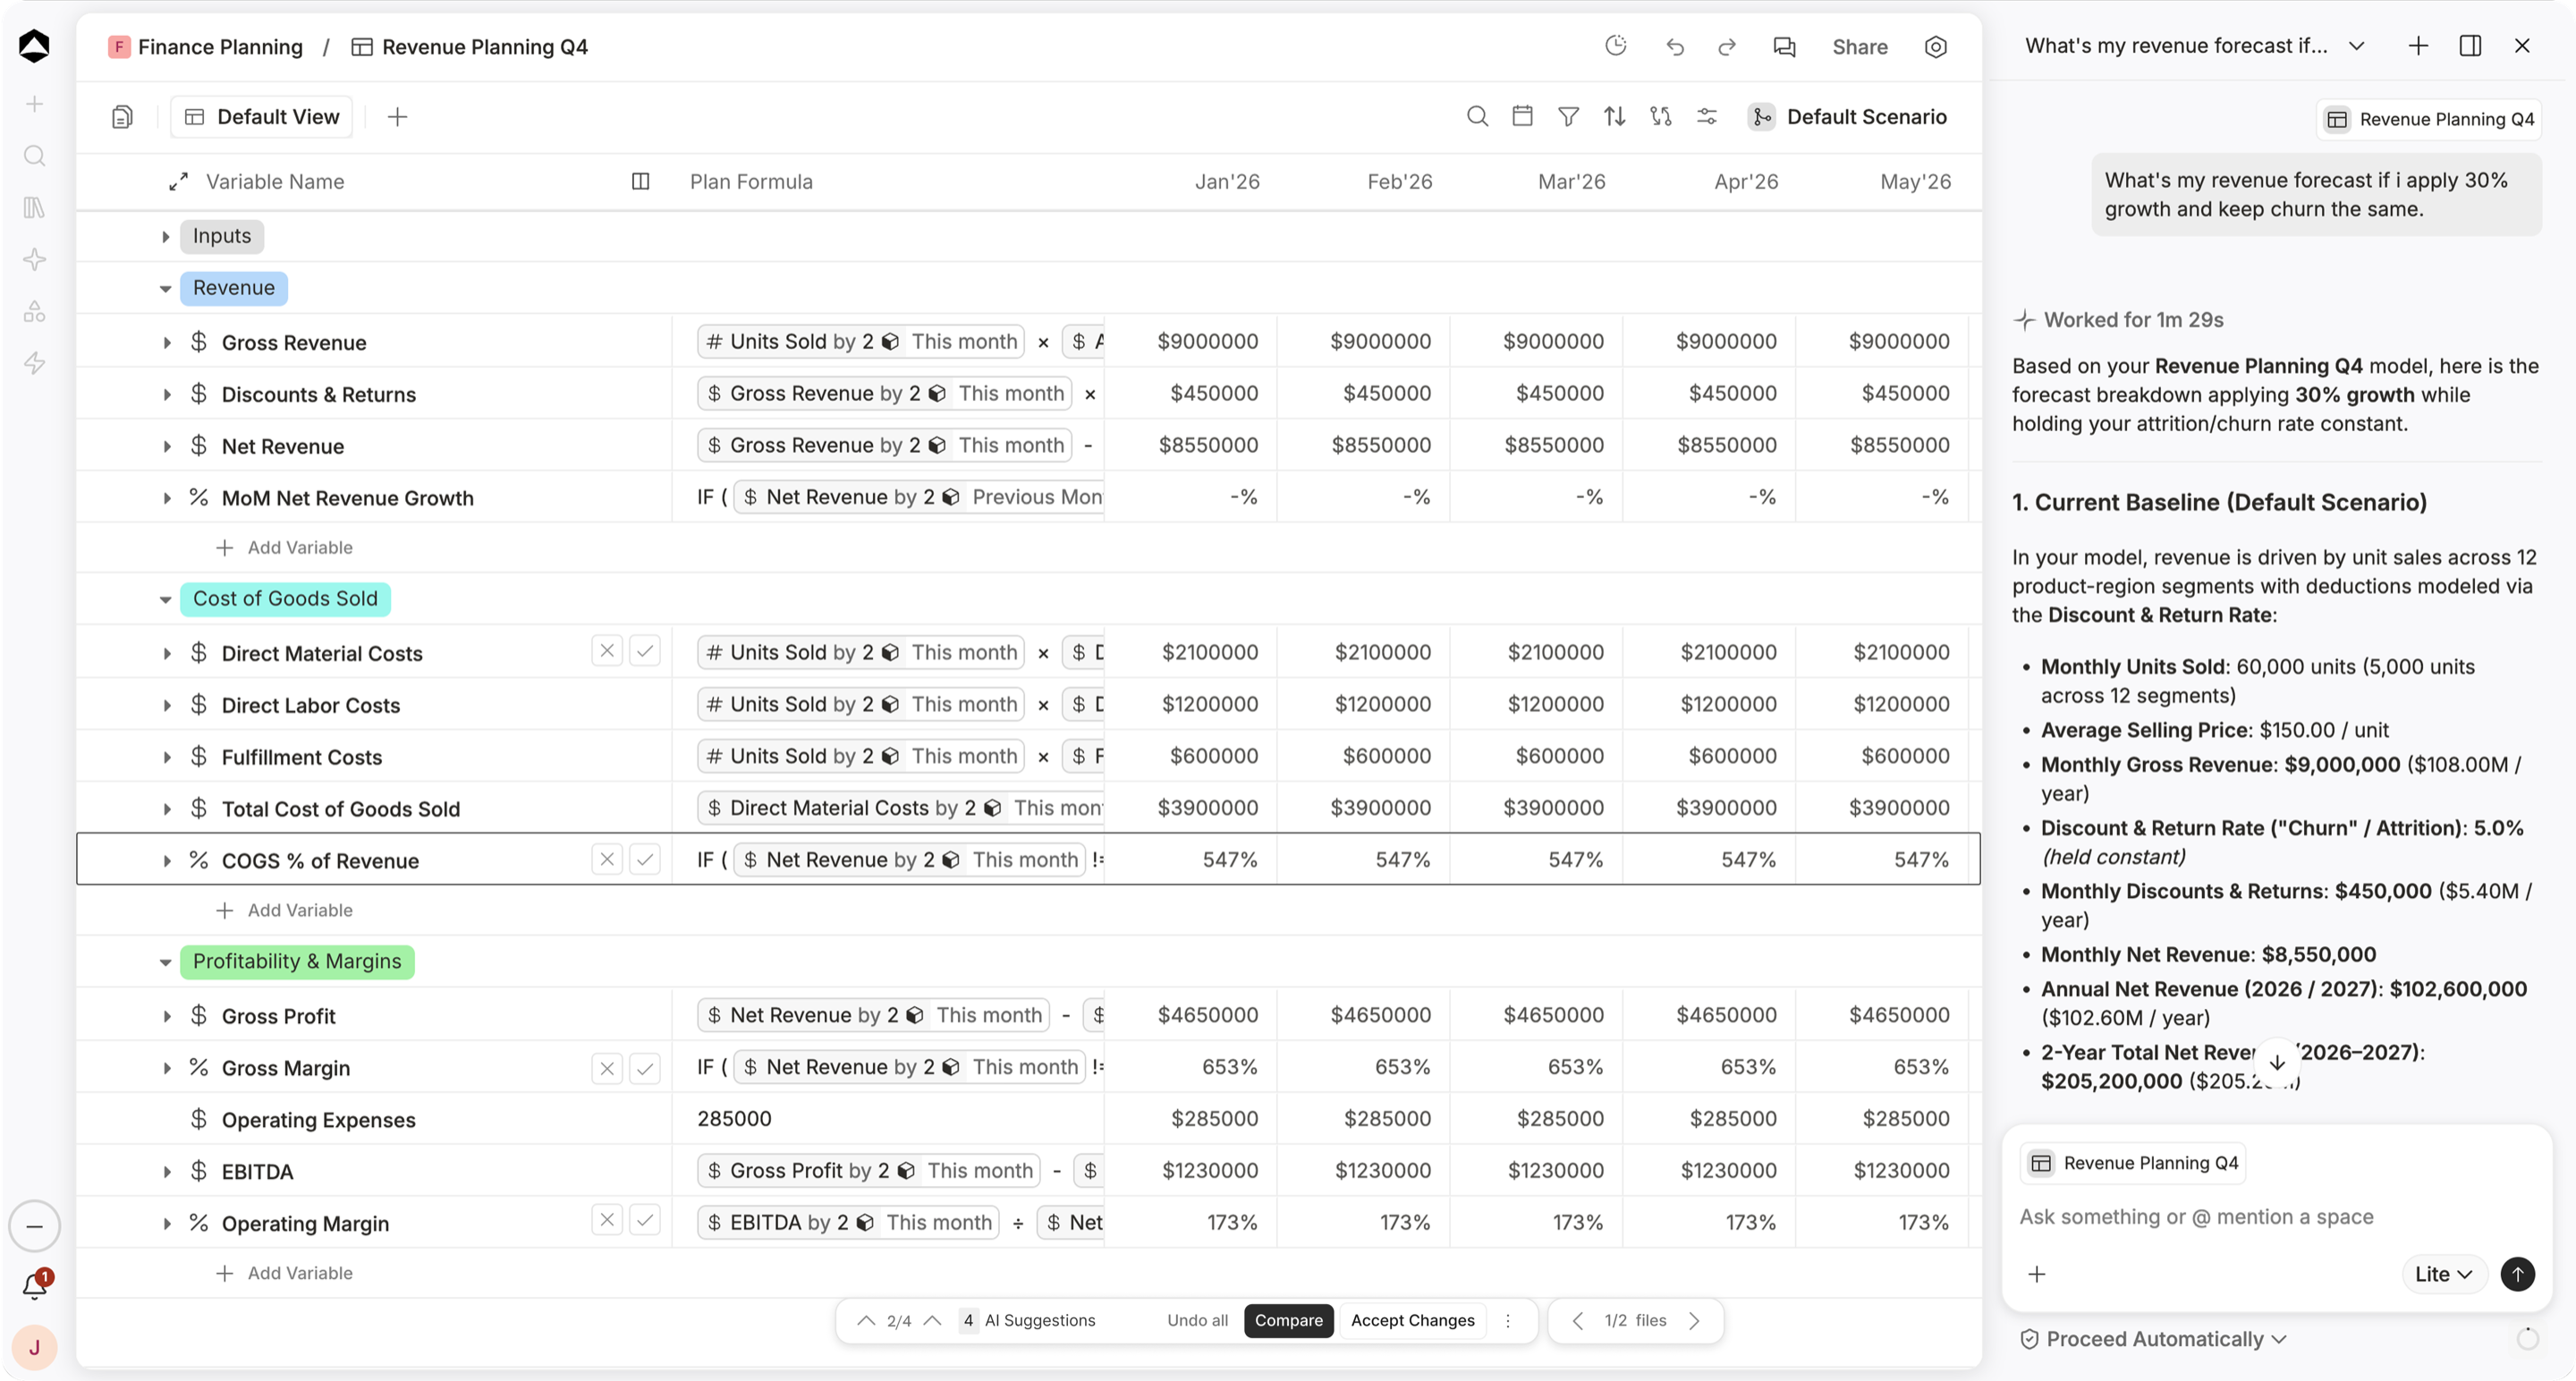
Planning choices
Show the cash commitment
Connect planned purchases and inventory levels to working capital.
Explore scenarios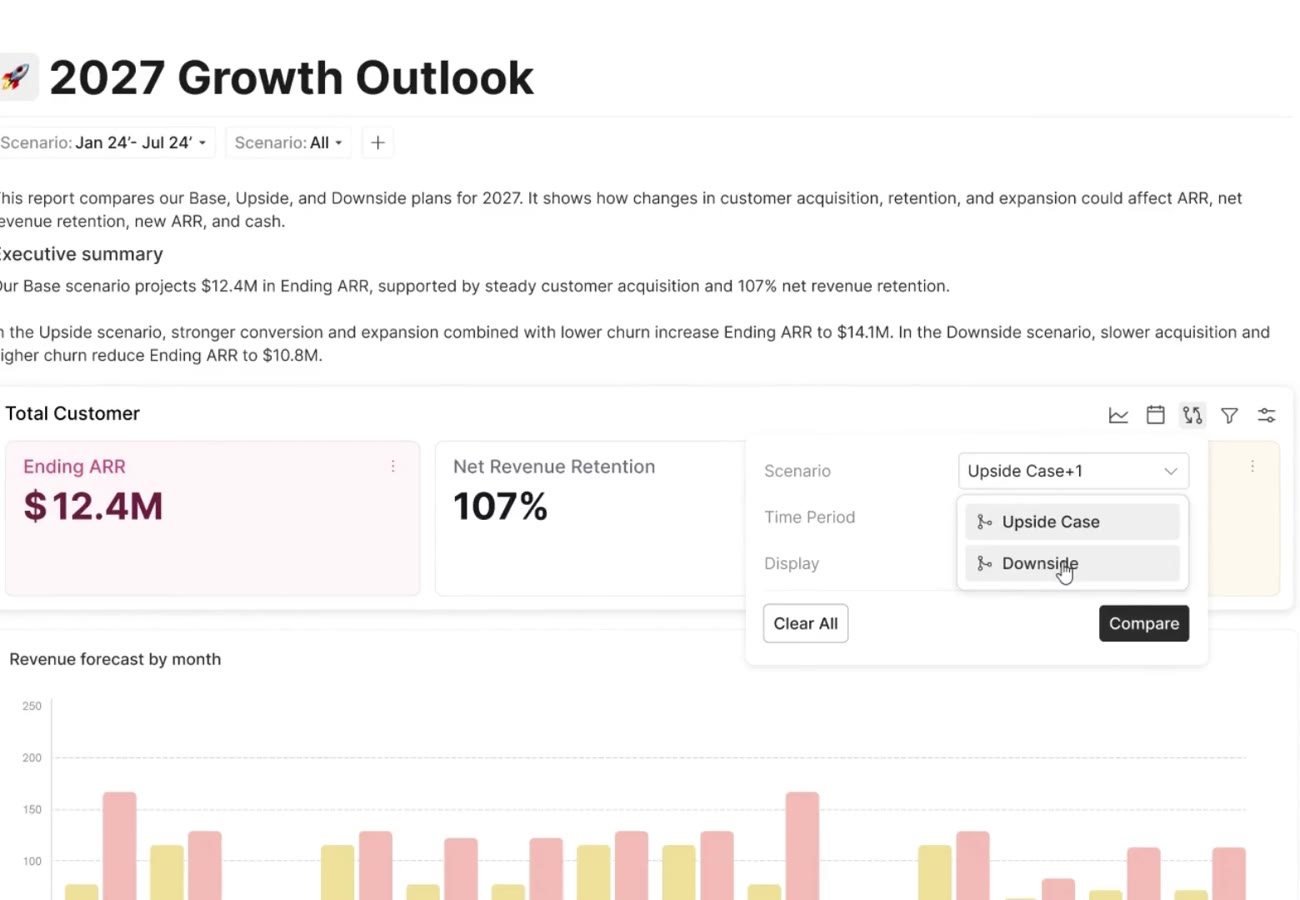
Shared review
Test replenishment
Check lead times, minimum order quantities, and service-level exposure before reducing purchase commitments.
Explore shared boards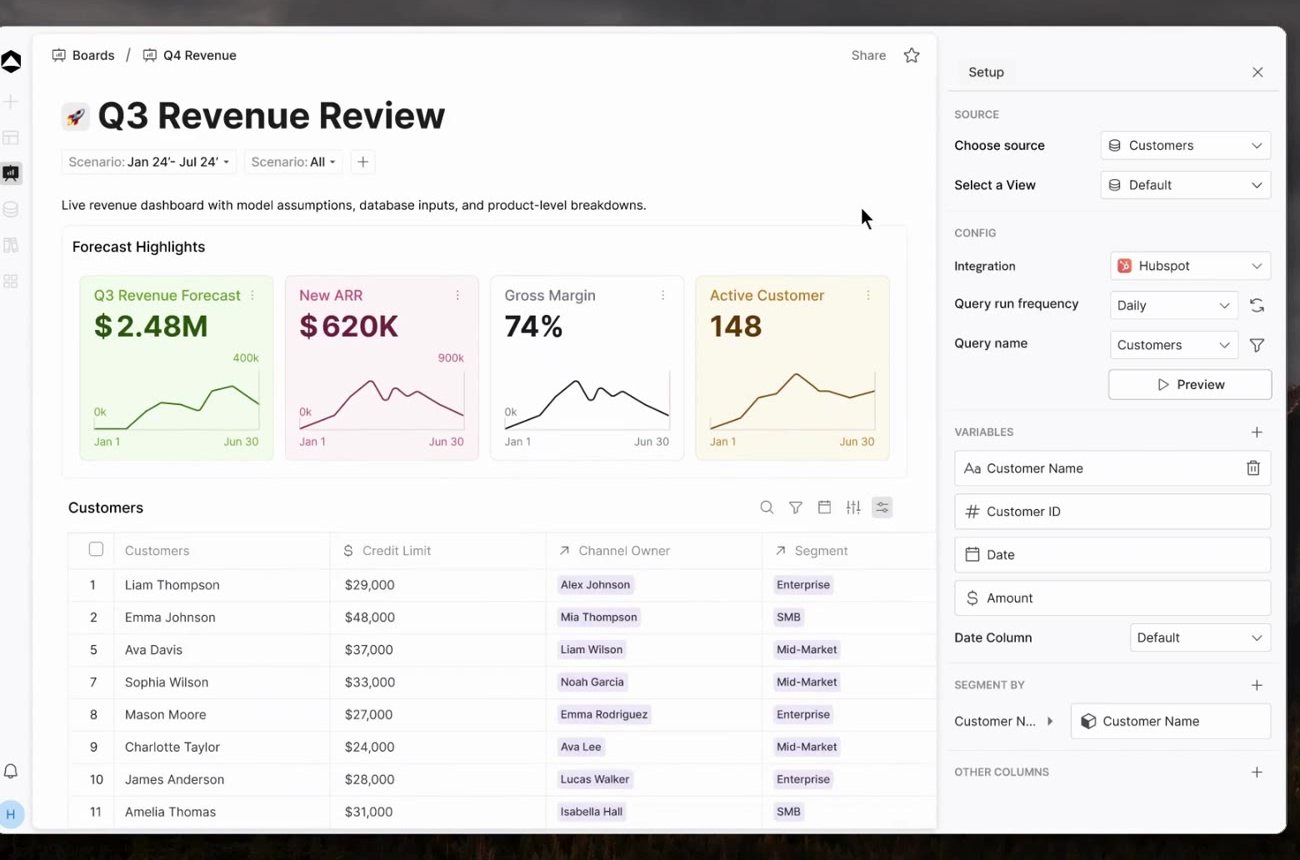
One connected financial picture
Which stock assumptions sit behind $120K less inventory?
Check lead times, minimum order quantities, and service-level exposure before reducing purchase commitments.
Explore the inventory & cost plan example
Days of cover = on-hand units ÷ expected daily demand. Inventory value is measured at modeled unit cost, separately from open purchase commitments.
October 2026 · inventory planning snapshot · Illustrative dataEXPLORE THE DECISION
Which stock assumptions sit behind $120K less inventory?
Inventory cover by product
Days of cover$18 unit cost · Reorder review
$36 unit cost · Within plan
$24 unit cost · Excess review
Cover assumptions by product; summary stock values describe the separate illustrative inventory plan.
Inspect the model inputs3 model lines
| Product | Days of cover | Unit cost | Review |
|---|---|---|---|
| 24 days | $18 | Reorder review | |
| 42 days | $36 | Within plan | |
| 68 days | $24 | Excess review |
Scroll to inspect all columns
Summary values represent the illustrative stock plan. Product cover is a selected planning assumption, not a guaranteed service level or automatic reorder recommendation.
A little more context
Questions about Inventory & Cost Planning.
Can we compare costs by product or supplier?
Use dimensions and models to keep cost assumptions in their product, supplier, or regional context. The planning view should reflect your definitions of landed cost and contribution.
Does lower cover always mean a better plan?
No. Less stock may release working capital but create service or replenishment risk. Review demand variability, supplier lead time, minimum quantities, and the cost of a stockout alongside the cash effect.
What should we agree before comparing plans?
Days of cover = on-hand units ÷ expected daily demand. Inventory value is measured at modeled unit cost, separately from open purchase commitments.
Where can we find a starting model?
Explore templates for planning, revenue, cash, headcount and reporting. Adapt the assumptions and structure to your business, and agree access with the people who will review the work.
Explore templates