Always current
No refresh, no pasted charts
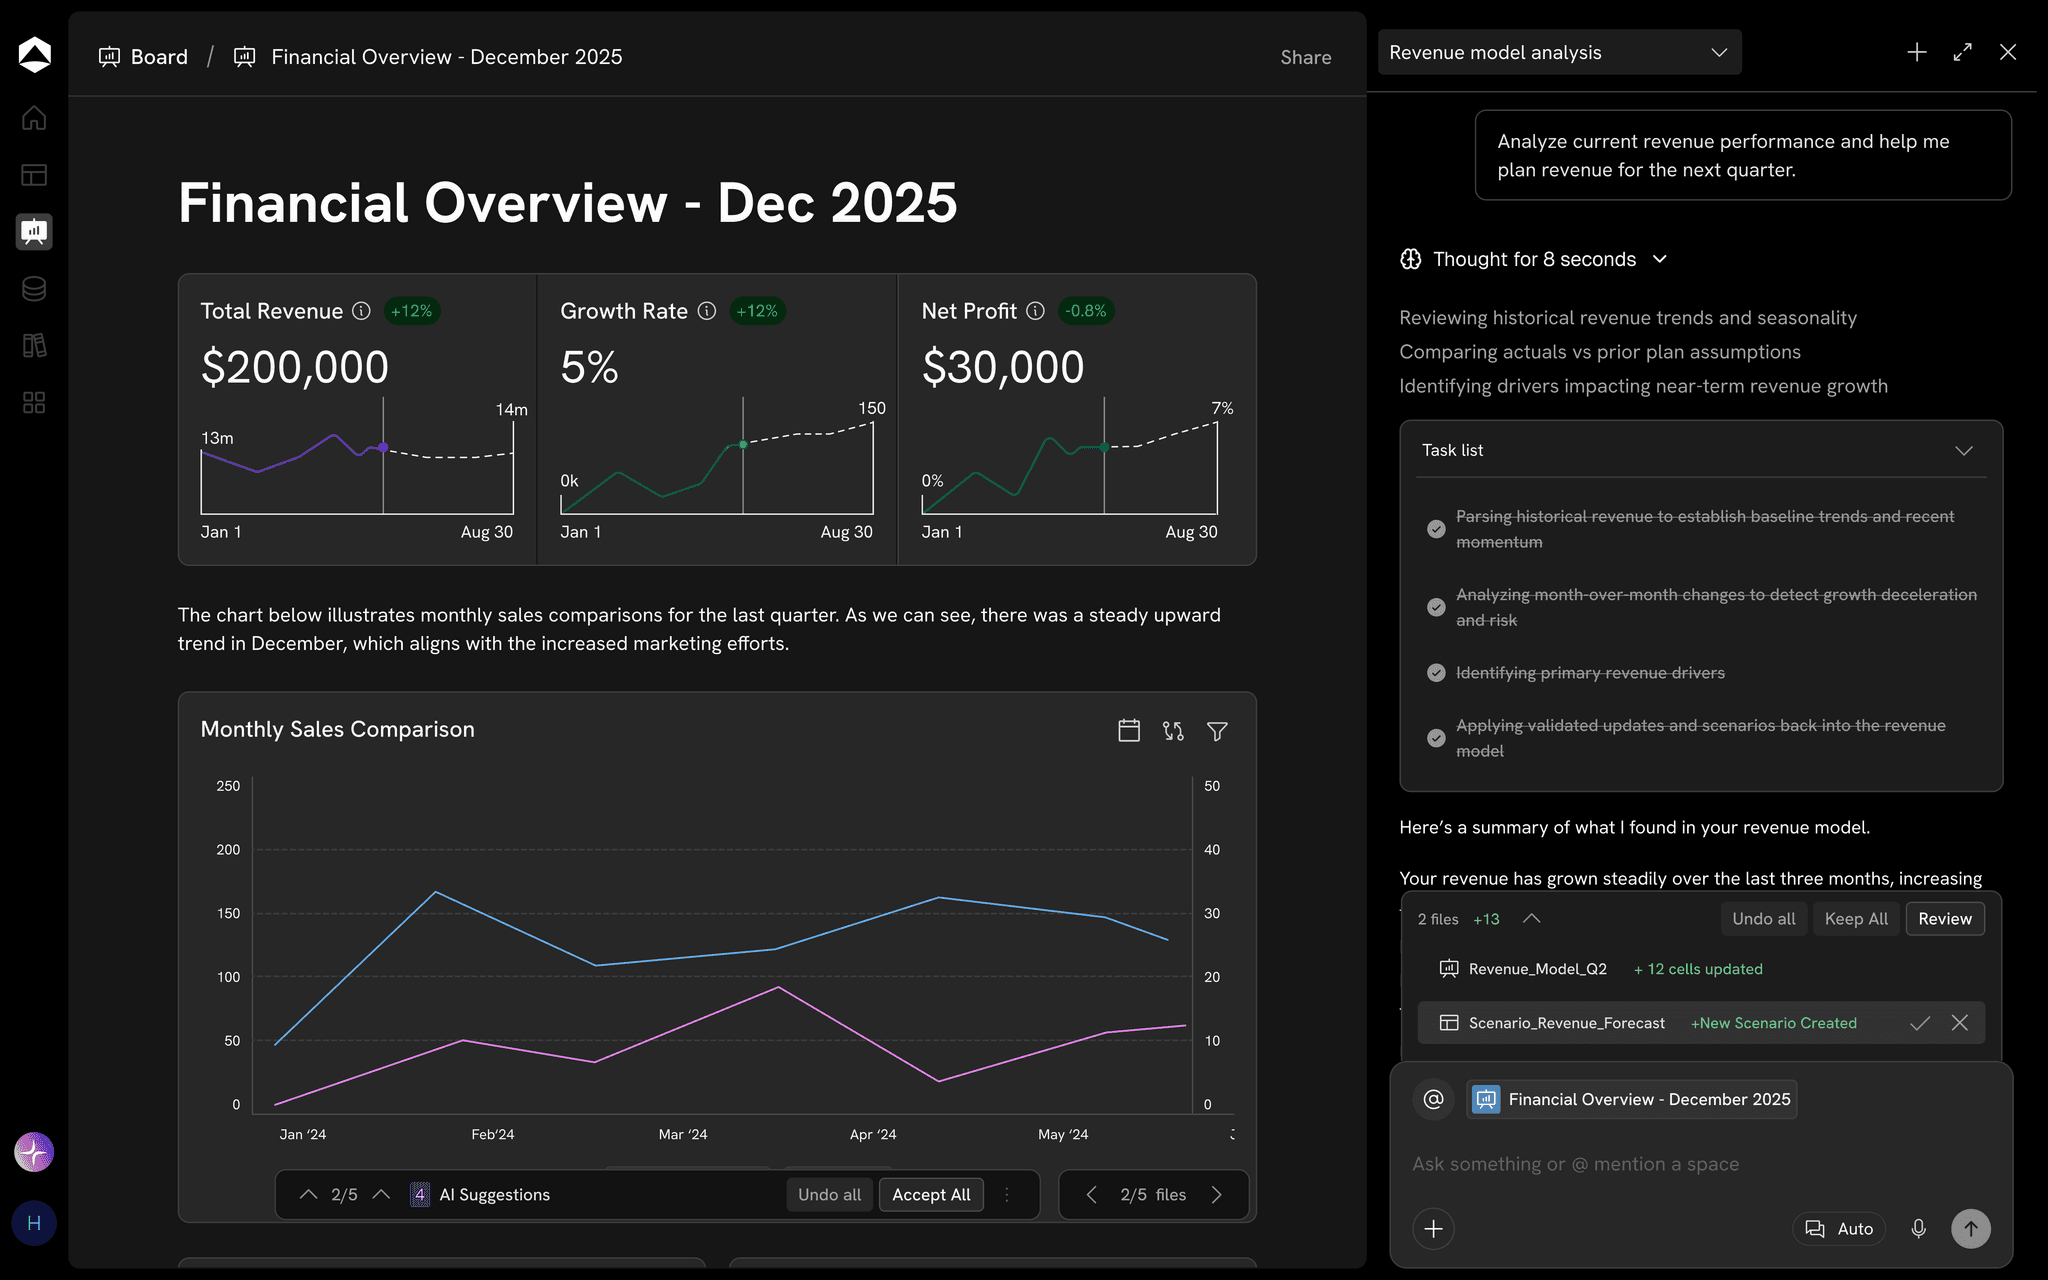
Move a revenue assumption in the forecast and keep the corresponding dashboard metric linked to that model rather than refreshing a pasted chart.
Build a leadership dashboard, department review or board update on the same connected financial model, with each audience seeing the right level of detail.
A workspace the whole company can use, without anyone seeing more than they should.

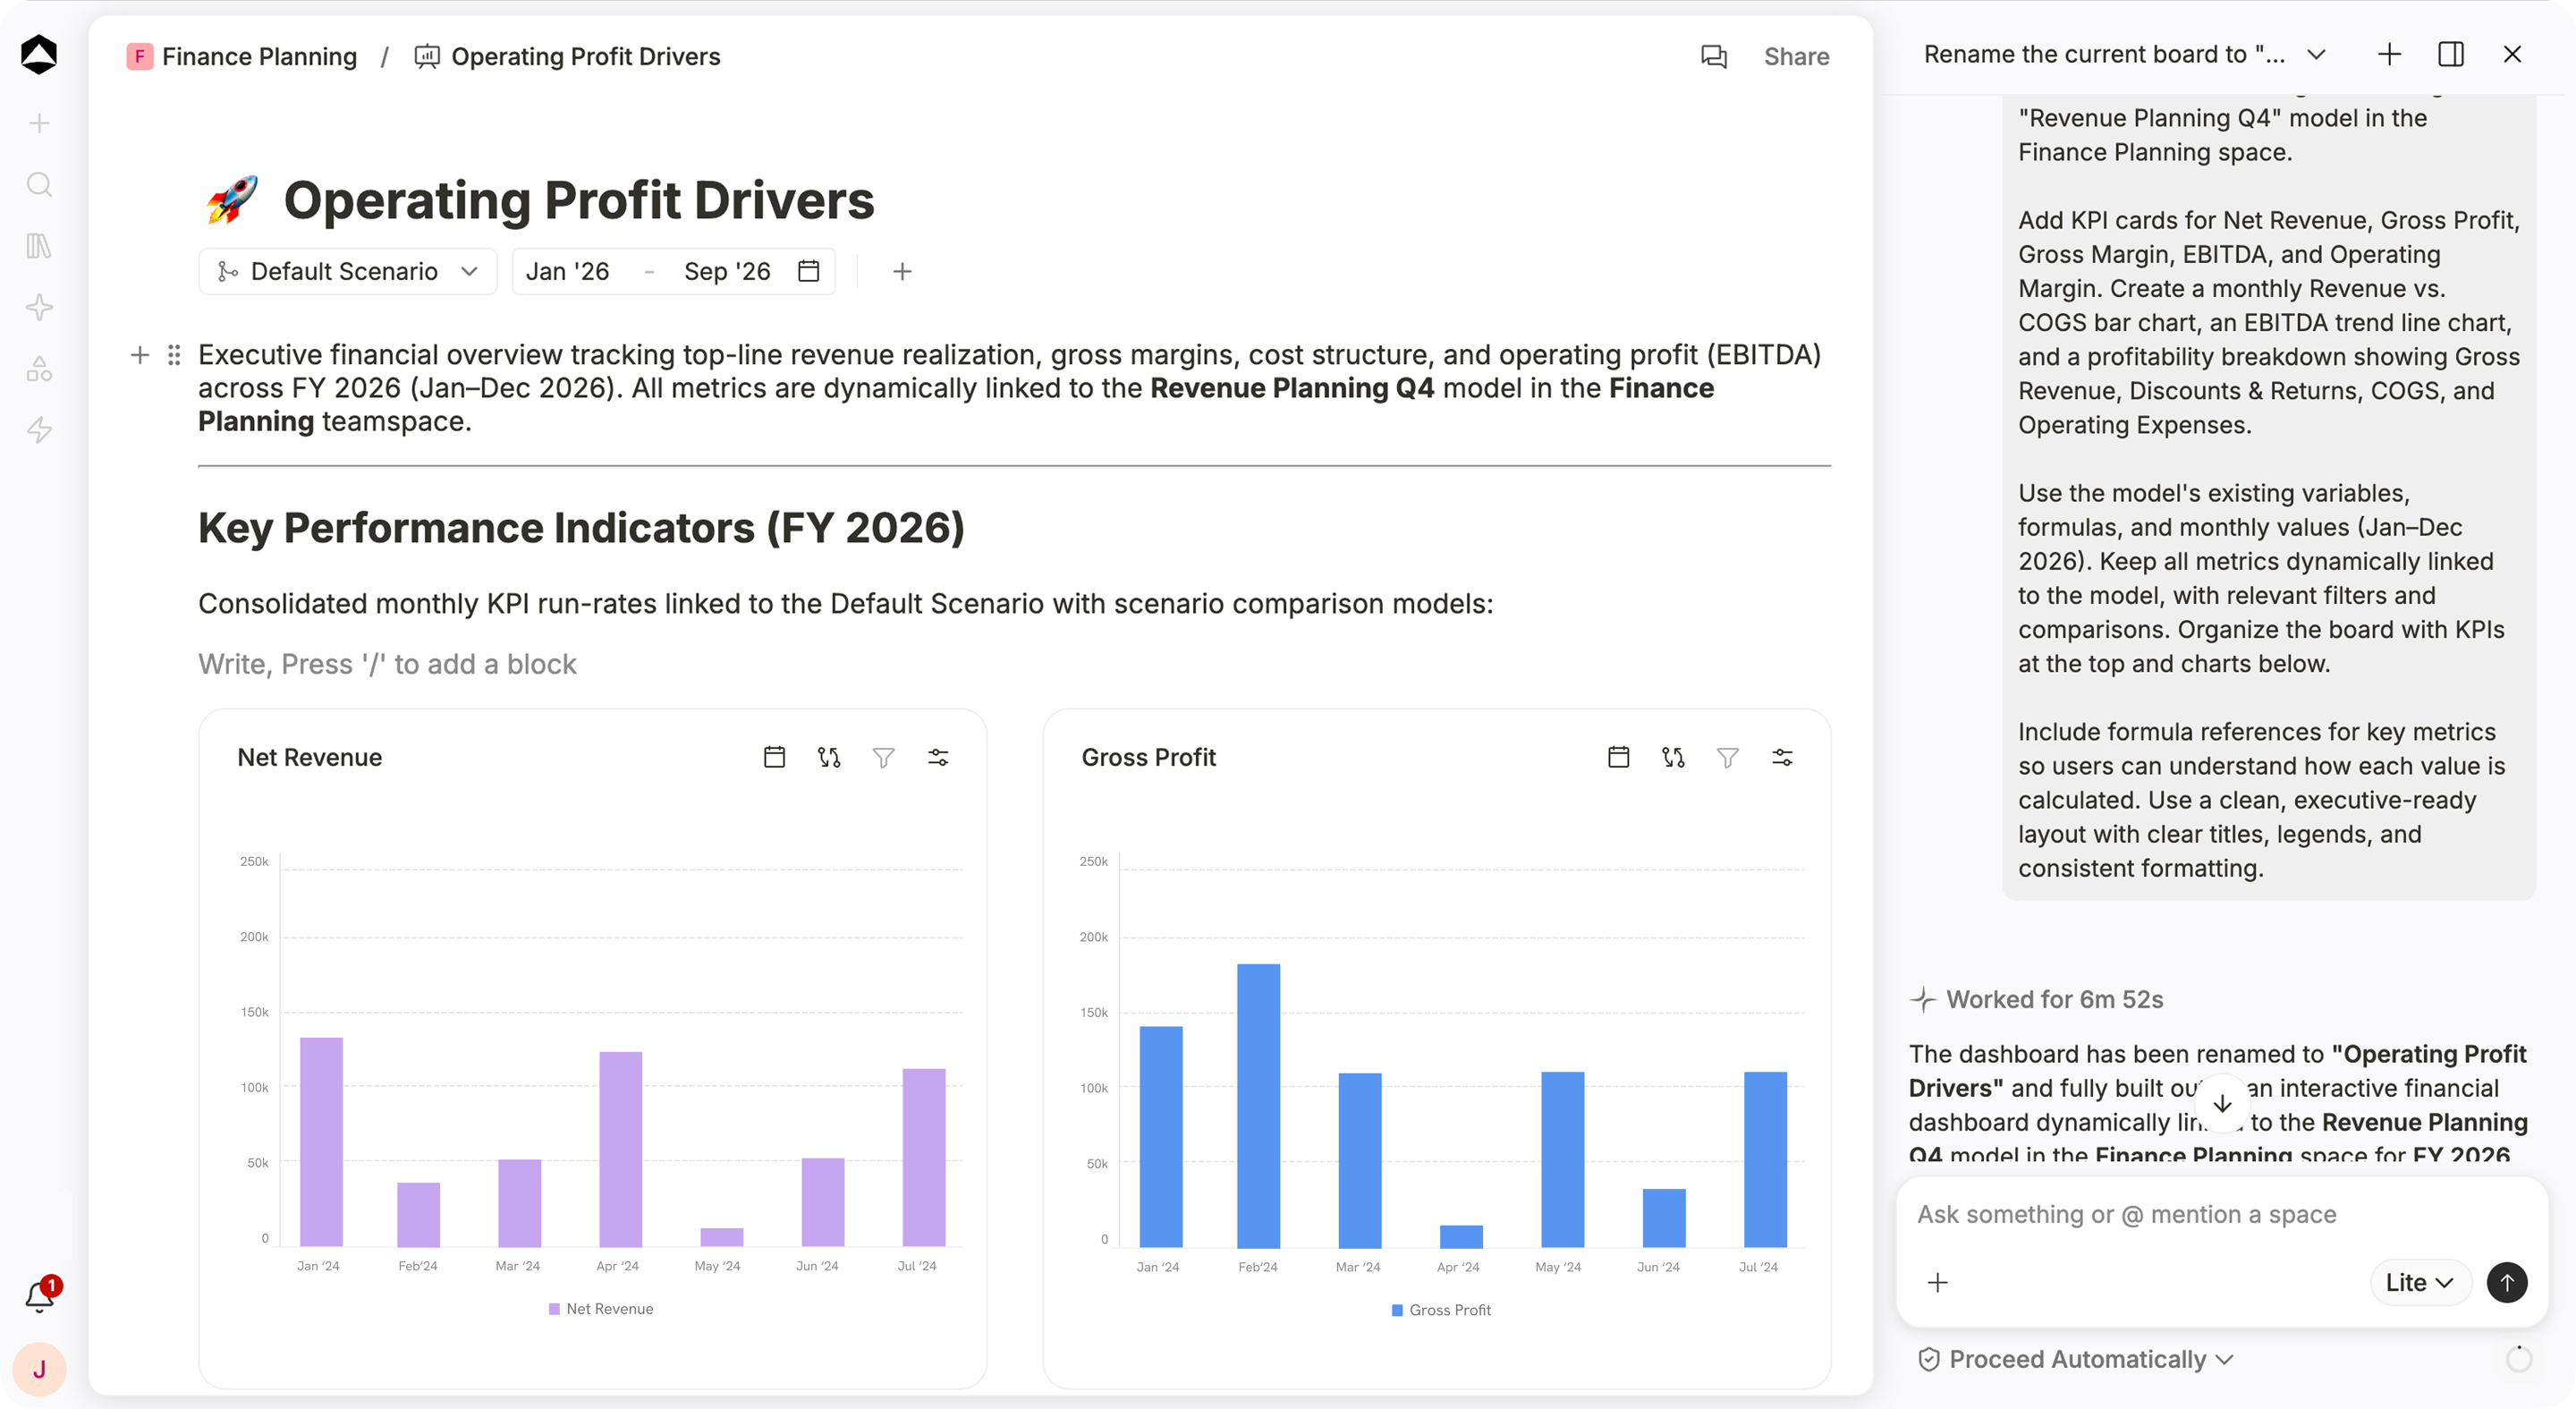
Operating Profit Drivers: live KPIs, charts and the formulas behind them, with the agent explaining what moved.
The CFO, sales leader and board can ask different questions without maintaining different versions of the truth.
Move a revenue assumption in the forecast and keep the corresponding dashboard metric linked to that model rather than refreshing a pasted chart.
Start with revenue, gross margin, runway or another defined variable, then arrange the measures into a useful executive view.
Break performance down by product, region, entity or period without maintaining separate dashboards for each combination.
Open a variance on the dashboard and compare periods or scenarios before taking it back to the model.
Use the same financial context to investigate the driver behind a chart while the dashboard remains the shared reference.
What drove the drop in operating profit in March?
Operating profit fell $34K in March. Revenue rose $50K, but opex rose $84K: hosting added $78K, two support hires added $14K, and licence credits returned $8K.
Give department owners their relevant metrics while keeping sensitive employee or entity-level information out of their view.
Updated live from the FY26 model · Base scenario
Gross margin is the one number off plan this month, down 2.1 points on EU hosting. Everything else is on track.
Same layout every quarter · numbers locked to approved version v13
The same layout every quarter, with numbers locked to approved version v13, so the board compares like with like.
Department targets next to the operating KPIs behind them
Bookings are at 82% of target because coverage fell to 2.6×. The scorecard shows the cause next to the result.
Plan, actuals, variance and commentary on one board
Three variances explain October, each with its owner and commentary. Revenue −$220K is timing, not demand.
Operating capacity next to its impact on the plan
Support utilisation passes 100% in June. Three hires in May fix it for $54K, already reflected in the plan.
Boards connect directly to Oculon models and databases, so reporting stays tied to the financial and operating context underneath it.
Yes. Configure cards, layouts, filters and selectors to create different reporting experiences from the same underlying data.
Yes. Users can move from a headline metric into the supporting charts, tables and underlying context to understand what is driving it.
Yes. Oculon supports controlled reporting access and published dashboards for broader audiences.