Use cases · Oculon for Pricing & Unit Economics
Pricing & Unit EconomicsTest the volume behind the better price.
A higher price improves contribution only if the volume assumption holds. Compare demand sensitivity, not just the arithmetic of a price increase.
The decision behind the work
A pricing conversation with the cost context attached.
For Finance, product, and commercial teams.
Use realized price
Compare what customers pay after discounts, not a headline list price.
Test the volume
Reduce the alternative volume and see when contribution falls below the current-price case.
Review the response
Bring demand evidence and delivery costs into the pricing decision.
From context to the next move
Put the plan to work.
Keep the inputs, model and review connected around the work in front of you.
Connected inputs
Keep price and volume together
Make the demand assumption explicit rather than assuming a price increase preserves volume.
Explore connected data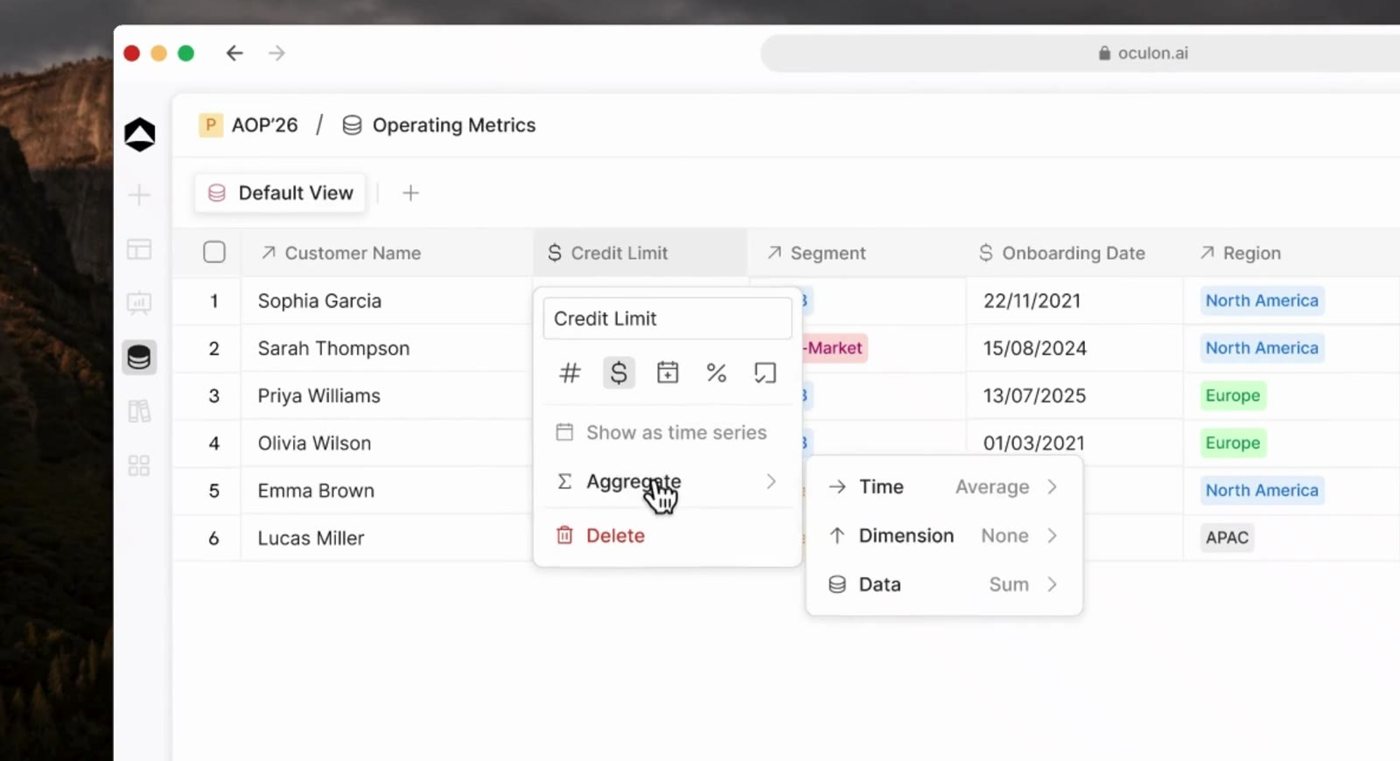
Business drivers
Understand the unit cost
Connect product and delivery-cost assumptions to contribution.
Explore financial models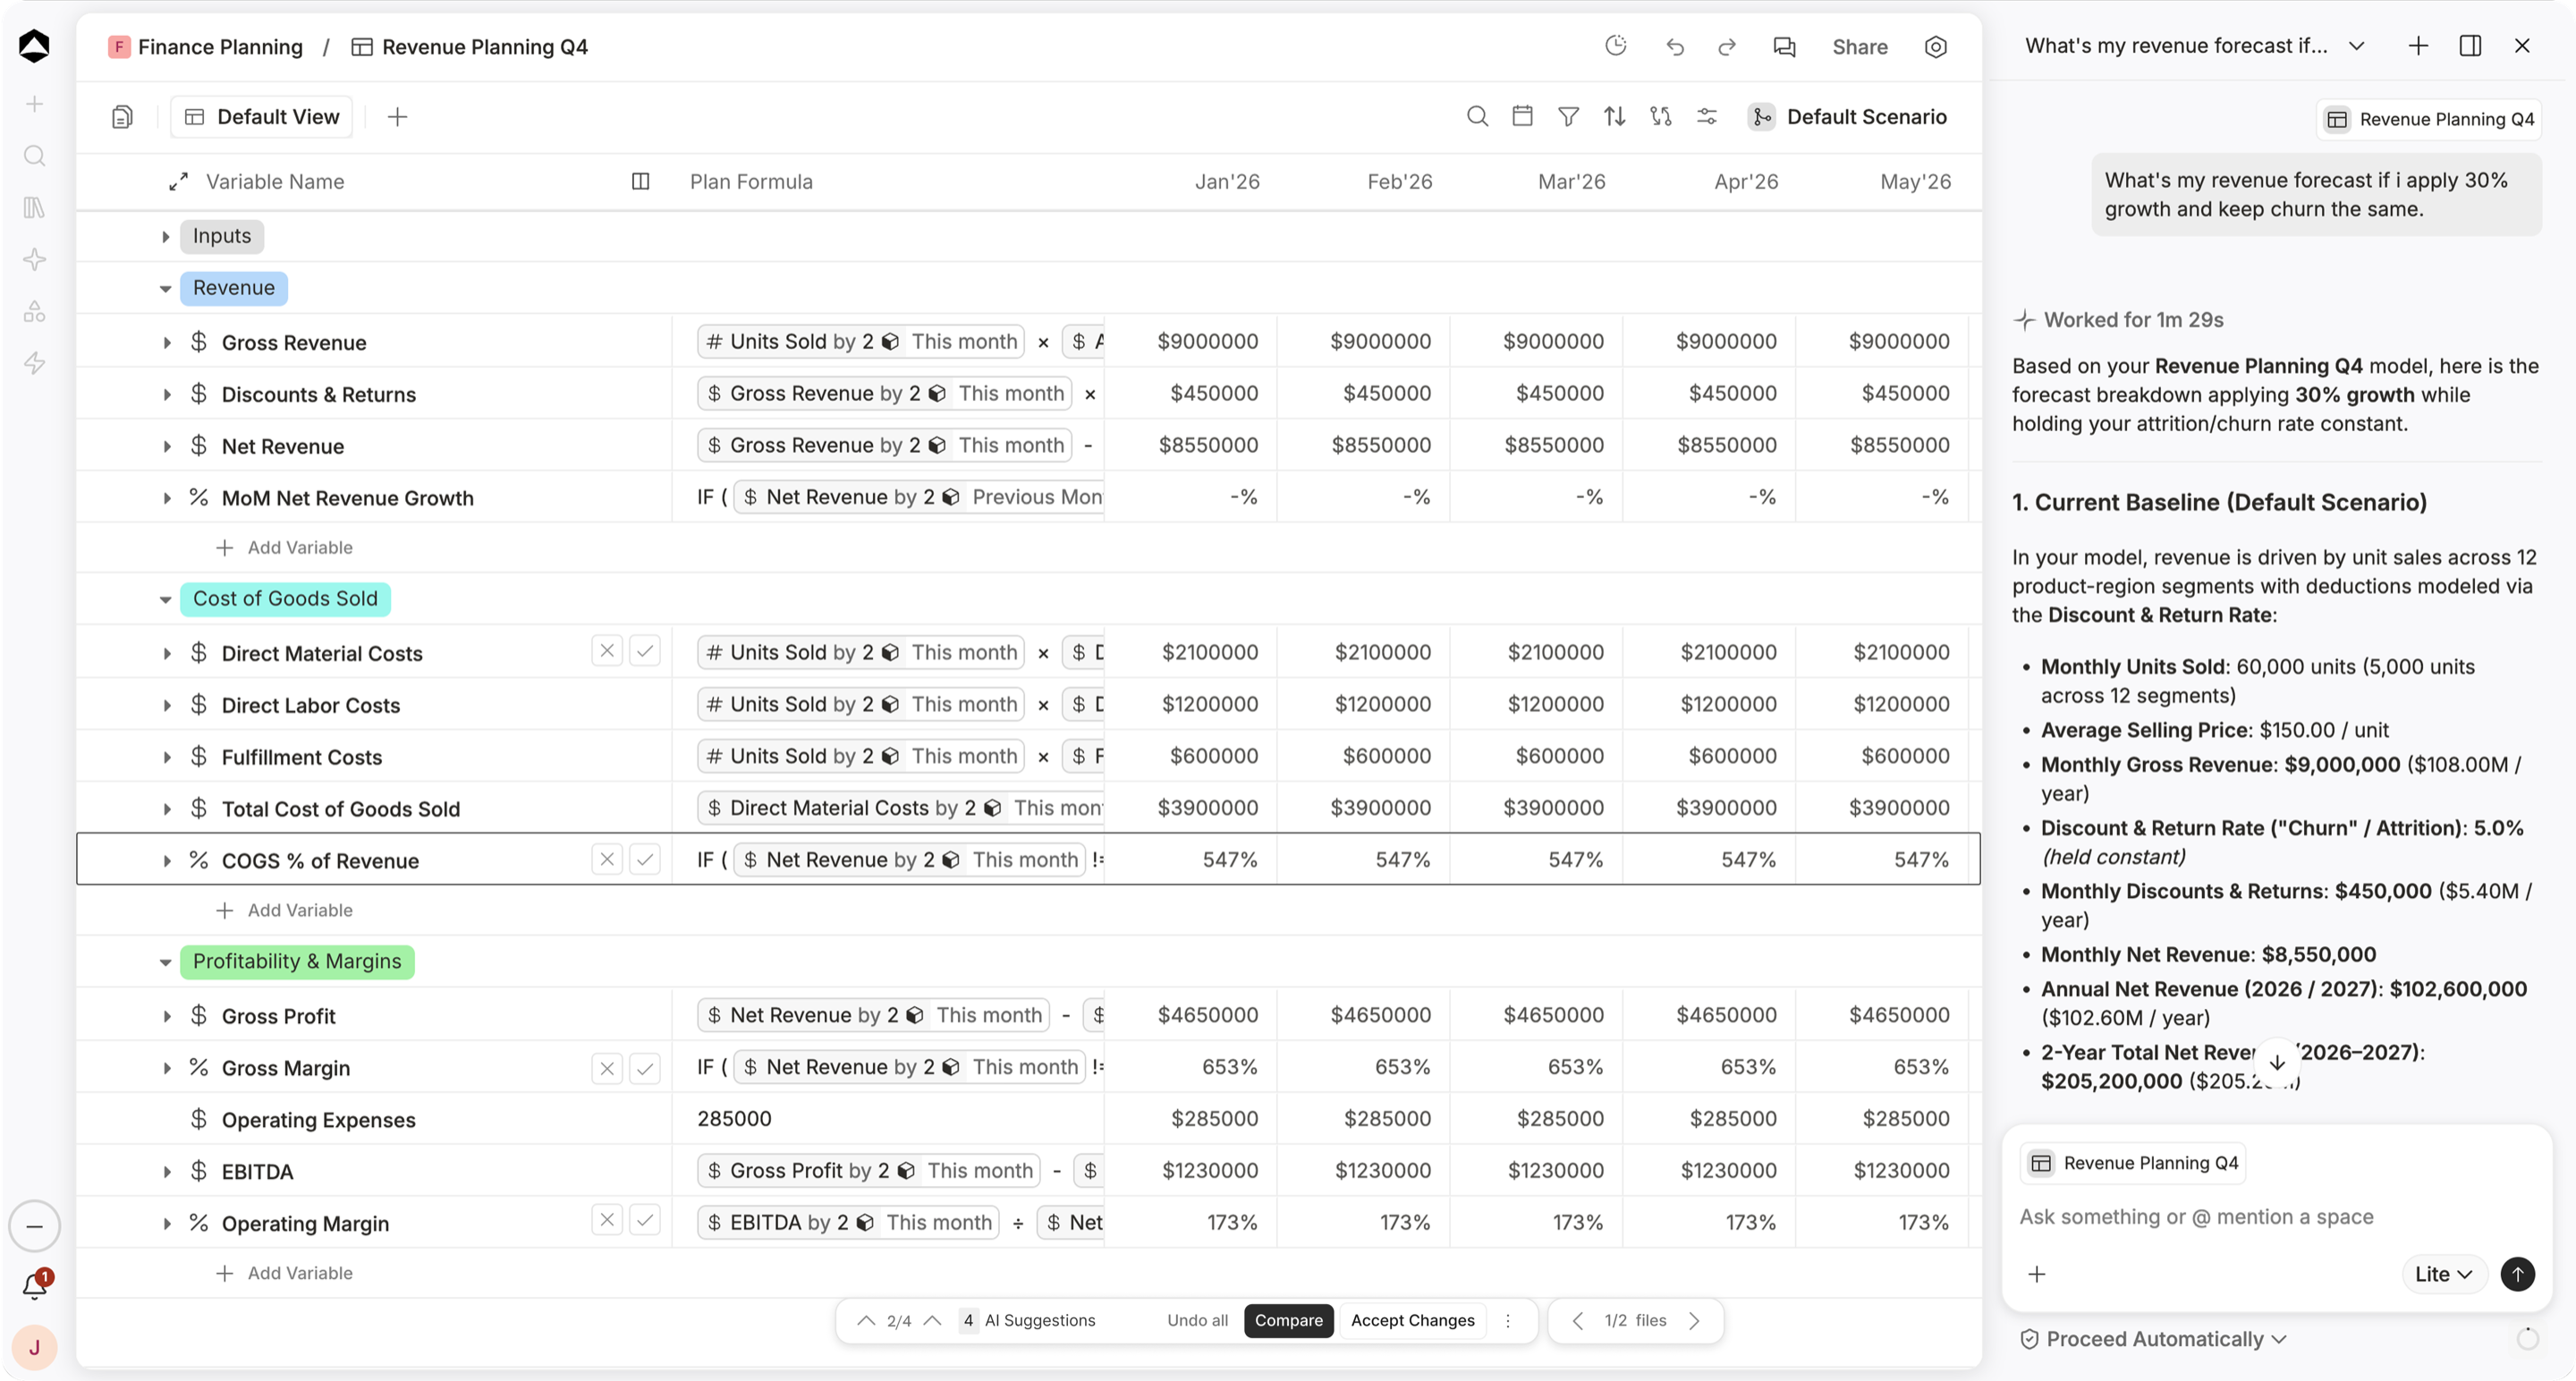
Planning choices
Bring the wider plan along
Review the choice with operating costs, billing, and cash timing.
Explore scenariosShared review
Review the response
Challenge demand response and discounts before choosing the price. A modeled break-even volume is not a prediction of customer behavior.
Explore shared boards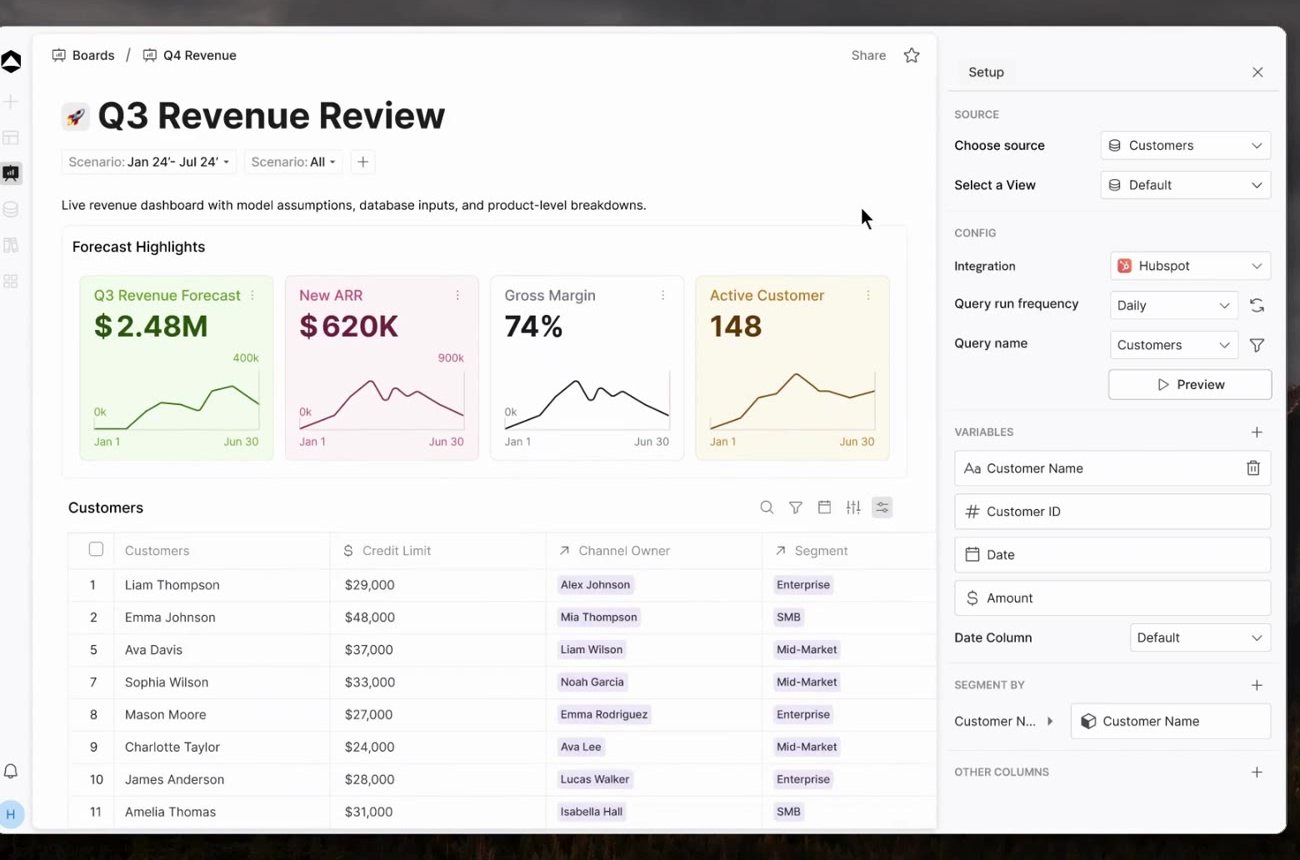
One connected financial picture
How much volume can the higher-price case lose?
Challenge demand response and discounts before choosing the price. A modeled break-even volume is not a prediction of customer behavior.
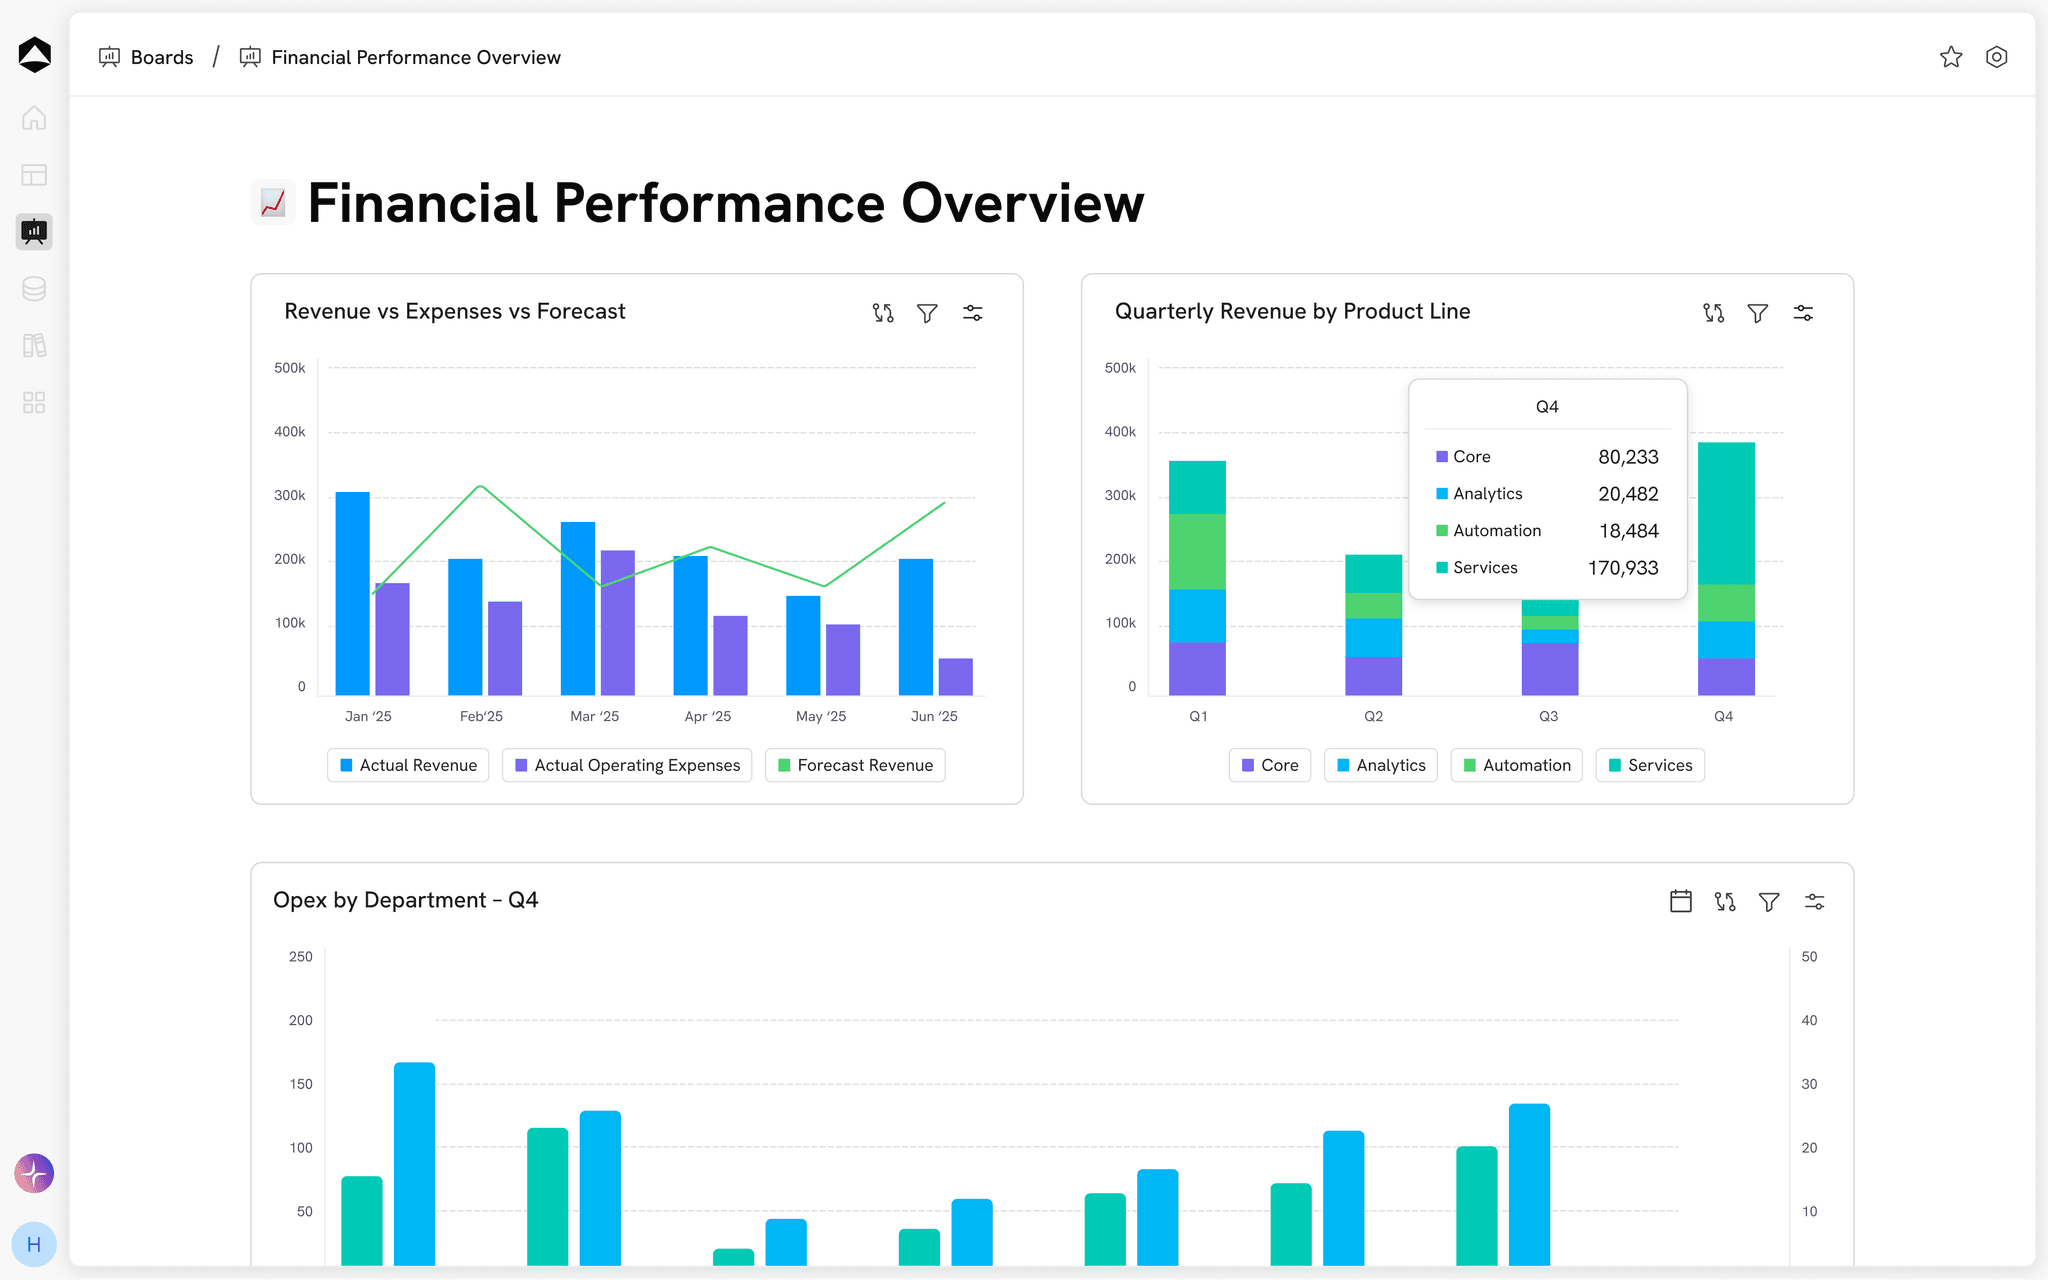
Explore the pricing decision example
Unit contribution = realized price − variable unit cost. Period contribution = unit contribution × volume.
October 2026 · sample selling period · Illustrative dataEXPLORE THE DECISION
How much volume can the higher-price case lose?
The economics of one unit
USD per unitPer modeled unit · contribution before fixed costs
Inspect the model inputs3 model lines
| Assumption | Current price | Price alternative | Scope |
|---|---|---|---|
| $100 | $110 | After discounts | |
| $65 | $65 | Cost held constant | |
| 1,000 | 1,000 | Volume held constant |
Scroll to inspect all columns
Realized price is after discounts. Variable cost stays at $65; fixed costs, delivery constraints, and actual demand response are excluded.
A little more context
Questions about Pricing & Unit Economics.
Should price and volume always be tested together?
A useful pricing scenario makes the volume assumption explicit. The example holds volume constant to isolate price; the business model should also explore how customer demand or mix could change.
Is the break-even volume a demand forecast?
No. It is the arithmetic volume needed to match baseline contribution. Customer research, observed price response, mix, and rollout assumptions determine whether that volume is credible.
What should we agree before comparing plans?
Unit contribution = realized price − variable unit cost. Period contribution = unit contribution × volume.
Where can we find a starting model?
Explore templates for planning, revenue, cash, headcount and reporting. Adapt the assumptions and structure to your business, and agree access with the people who will review the work.
Explore templates